29
/
en
AIzaSyAYiBZKx7MnpbEhh9jyipgxe19OcubqV5w
April 1, 2024
56531
Small states
SST
false
2
1
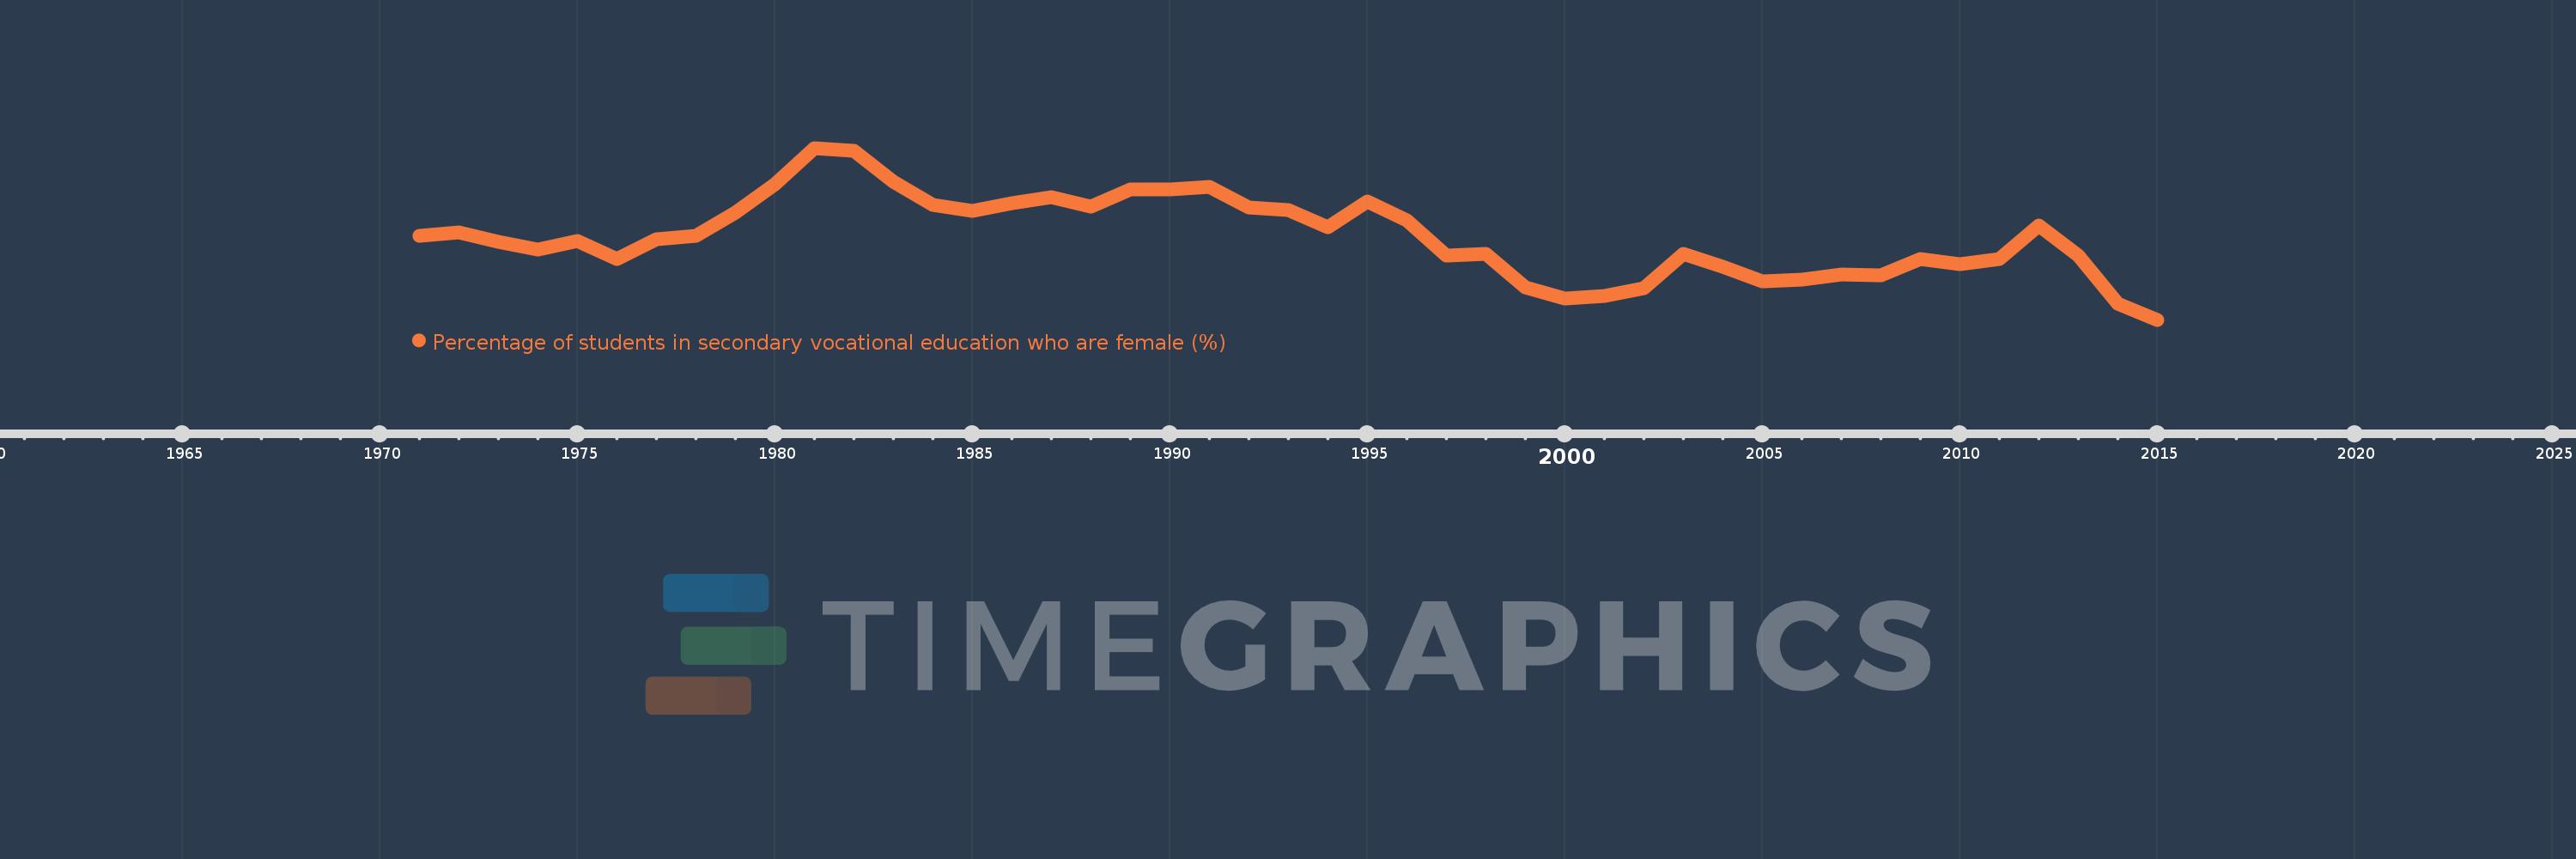
Percentage of students in secondary vocational education who are female (%)
2015,2014,2013,2012,2011,2010,2009,2008,2007,2006,2005,2004,2003,2002,2001,2000,1999,1998,1997,1996,1995,1994,1993,1992,1991,1990,1989,1988,1987,1986,1985,1984,1983,1982,1981,1980,1979,1978,1977,1976,1975,1974,1973,1972,1971
This statistics in other country:
AfghanistanAlbaniaAlgeriaAndorraAngolaAntigua and BarbudaArab WorldArgentinaArmeniaArubaAustraliaAustriaAzerbaijanBahrainBangladeshBarbadosBelarusBelgiumBelizeBeninBermudaBhutanBoliviaBosnia and HerzegovinaBotswanaBrazilBritish Virgin IslandsBrunei DarussalamBulgariaBurkina FasoBurundiCabo VerdeCambodiaCameroonCanadaCaribbean small statesCentral African RepublicCentral Europe and the BalticsChadChileChinaColombiaComorosCongo, Dem. Rep.Congo, Rep.Costa RicaCote d'IvoireCroatiaCubaCuracaoCyprusCzech RepublicDenmarkDjiboutiDominicaDominican RepublicEarly-demographic dividendEast Asia & PacificEast Asia & Pacific (excluding high income)East Asia & Pacific (IDA & IBRD countries)EcuadorEgypt, Arab Rep.El SalvadorEquatorial GuineaEritreaEstoniaEthiopiaEuro areaEurope & Central AsiaEurope & Central Asia (excluding high income)Europe & Central Asia (IDA & IBRD countries)European UnionFijiFinlandFragile and conflict affected situationsFranceGabonGambia, TheGeorgiaGermanyGhanaGibraltarGreeceGrenadaGuatemalaGuineaGuinea-BissauGuyanaHaitiHeavily indebted poor countries (HIPC)High incomeHondurasHong Kong SAR, ChinaHungaryIBRD onlyIcelandIDA & IBRD totalIDA blendIDA onlyIDA totalIndiaIndonesiaIran, Islamic Rep.IraqIrelandIsraelItalyJamaicaJapanJordanKazakhstanKenyaKiribatiKorea, Rep.KuwaitKyrgyz RepublicLao PDRLate-demographic dividendLatin America & Caribbean Latin America & Caribbean (excluding high income)Latin America & the Caribbean (IDA & IBRD countries)LatviaLeast developed countries: UN classificationLebanonLesothoLiberiaLibyaLiechtensteinLithuaniaLow & middle incomeLow incomeLower middle incomeLuxembourgMacao SAR, ChinaMacedonia, FYRMadagascarMalawiMalaysiaMaldivesMaliMaltaMarshall IslandsMauritaniaMauritiusMexicoMicronesia, Fed. Sts.Middle East & North AfricaMiddle East & North Africa (excluding high income)Middle East & North Africa (IDA & IBRD countries)Middle incomeMoldovaMonacoMongoliaMontenegroMoroccoMozambiqueMyanmarNamibiaNauruNepalNetherlandsNew ZealandNicaraguaNigerNigeriaNorth AmericaNorwayOECD membersOmanOther small statesPacific island small statesPakistanPanamaPapua New GuineaParaguayPeruPolandPortugalPost-demographic dividendPre-demographic dividendPuerto RicoQatarRomaniaRussian FederationRwandaSamoaSan MarinoSao Tome and PrincipeSaudi ArabiaSenegalSerbiaSeychellesSierra LeoneSingaporeSint Maarten (Dutch part)Slovak RepublicSloveniaSmall statesSolomon IslandsSomaliaSouth AfricaSouth AsiaSouth Asia (IDA & IBRD)SpainSri LankaSt. Kitts and NevisSt. LuciaSt. Vincent and the GrenadinesSub-Saharan Africa Sub-Saharan Africa (excluding high income)Sub-Saharan Africa (IDA & IBRD countries)SudanSurinameSwazilandSwedenSwitzerlandSyrian Arab RepublicTajikistanTanzaniaThailandTimor-LesteTogoTongaTrinidad and TobagoTunisiaTurkeyTurkmenistanTurks and Caicos IslandsTuvaluUgandaUkraineUnited Arab EmiratesUnited KingdomUpper middle incomeUruguayUzbekistanVanuatuVenezuela, RBVietnamWest Bank and GazaWorldYemen, Rep.ZambiaZimbabwe Timeline:
This timeline shows a graph from 1971 to 2015 of Small states. No data until 1970. Number of actual observations by date: 45.
Source name:
World Development Indicators
Source organization:
UNESCO Institute for Statistics
Categories, topics:
Education, Gender
Last updated:
apr 23, 2017
Indicators value changes by year
Minimum:
37.184
jan 1, 2015
Maximum:
43.298
jan 1, 1981
At the date of observation
Value
Absolute change
Change from previous value
jan 1, 1971
40.166
+40.166
0.0%
jan 1, 1972
40.279
+0.113
0.28%
jan 1, 1973
39.943
-0.336
-0.83%
jan 1, 1974
39.679
-0.264
-0.66%
jan 1, 1975
39.982
+0.302
0.76%
jan 1, 1976
39.351
-0.631
-1.58%
jan 1, 1977
40.06
+0.709
1.8%
jan 1, 1978
40.169
+0.109
0.27%
jan 1, 1979
41.005
+0.836
2.08%
jan 1, 1980
42.012
+1.008
2.46%
jan 1, 1981
43.298
+1.286
3.06%
jan 1, 1982
43.194
-0.104
-0.24%
jan 1, 1983
42.088
-1.107
-2.56%
jan 1, 1984
41.27
-0.818
-1.94%
jan 1, 1985
41.066
-0.203
-0.49%
jan 1, 1986
41.336
+0.27
0.66%
jan 1, 1987
41.532
+0.196
0.47%
jan 1, 1988
41.223
-0.309
-0.74%
jan 1, 1989
41.809
+0.586
1.42%
jan 1, 1990
41.833
+0.025
0.06%
jan 1, 1991
41.91
+0.076
0.18%
jan 1, 1992
41.177
-0.733
-1.75%
jan 1, 1993
41.089
-0.088
-0.21%
jan 1, 1994
40.487
-0.602
-1.47%
jan 1, 1995
41.39
+0.903
2.23%
jan 1, 1996
40.713
-0.677
-1.64%
jan 1, 1997
39.458
-1.255
-3.08%
jan 1, 1998
39.534
+0.076
0.19%
jan 1, 1999
38.326
-1.208
-3.06%
jan 1, 2000
37.928
-0.398
-1.04%
jan 1, 2001
38.019
+0.091
0.24%
jan 1, 2002
38.291
+0.272
0.71%
jan 1, 2003
39.524
+1.233
3.22%
jan 1, 2004
39.076
-0.448
-1.13%
jan 1, 2005
38.555
-0.521
-1.33%
jan 1, 2006
38.602
+0.047
0.12%
jan 1, 2007
38.787
+0.185
0.48%
jan 1, 2008
38.767
-0.019
-0.05%
jan 1, 2009
39.341
+0.573
1.48%
jan 1, 2010
39.16
-0.18
-0.46%
jan 1, 2011
39.342
+0.181
0.46%
jan 1, 2012
40.528
+1.186
3.02%
jan 1, 2013
39.459
-1.069
-2.64%
jan 1, 2014
37.759
-1.7
-4.31%
jan 1, 2015
37.184
-0.576
-1.52%
Ranking of countries by current statistics by years


Comments: