29
/
en
AIzaSyAYiBZKx7MnpbEhh9jyipgxe19OcubqV5w
April 1, 2024
74276
Austria
AUT
true
2
1
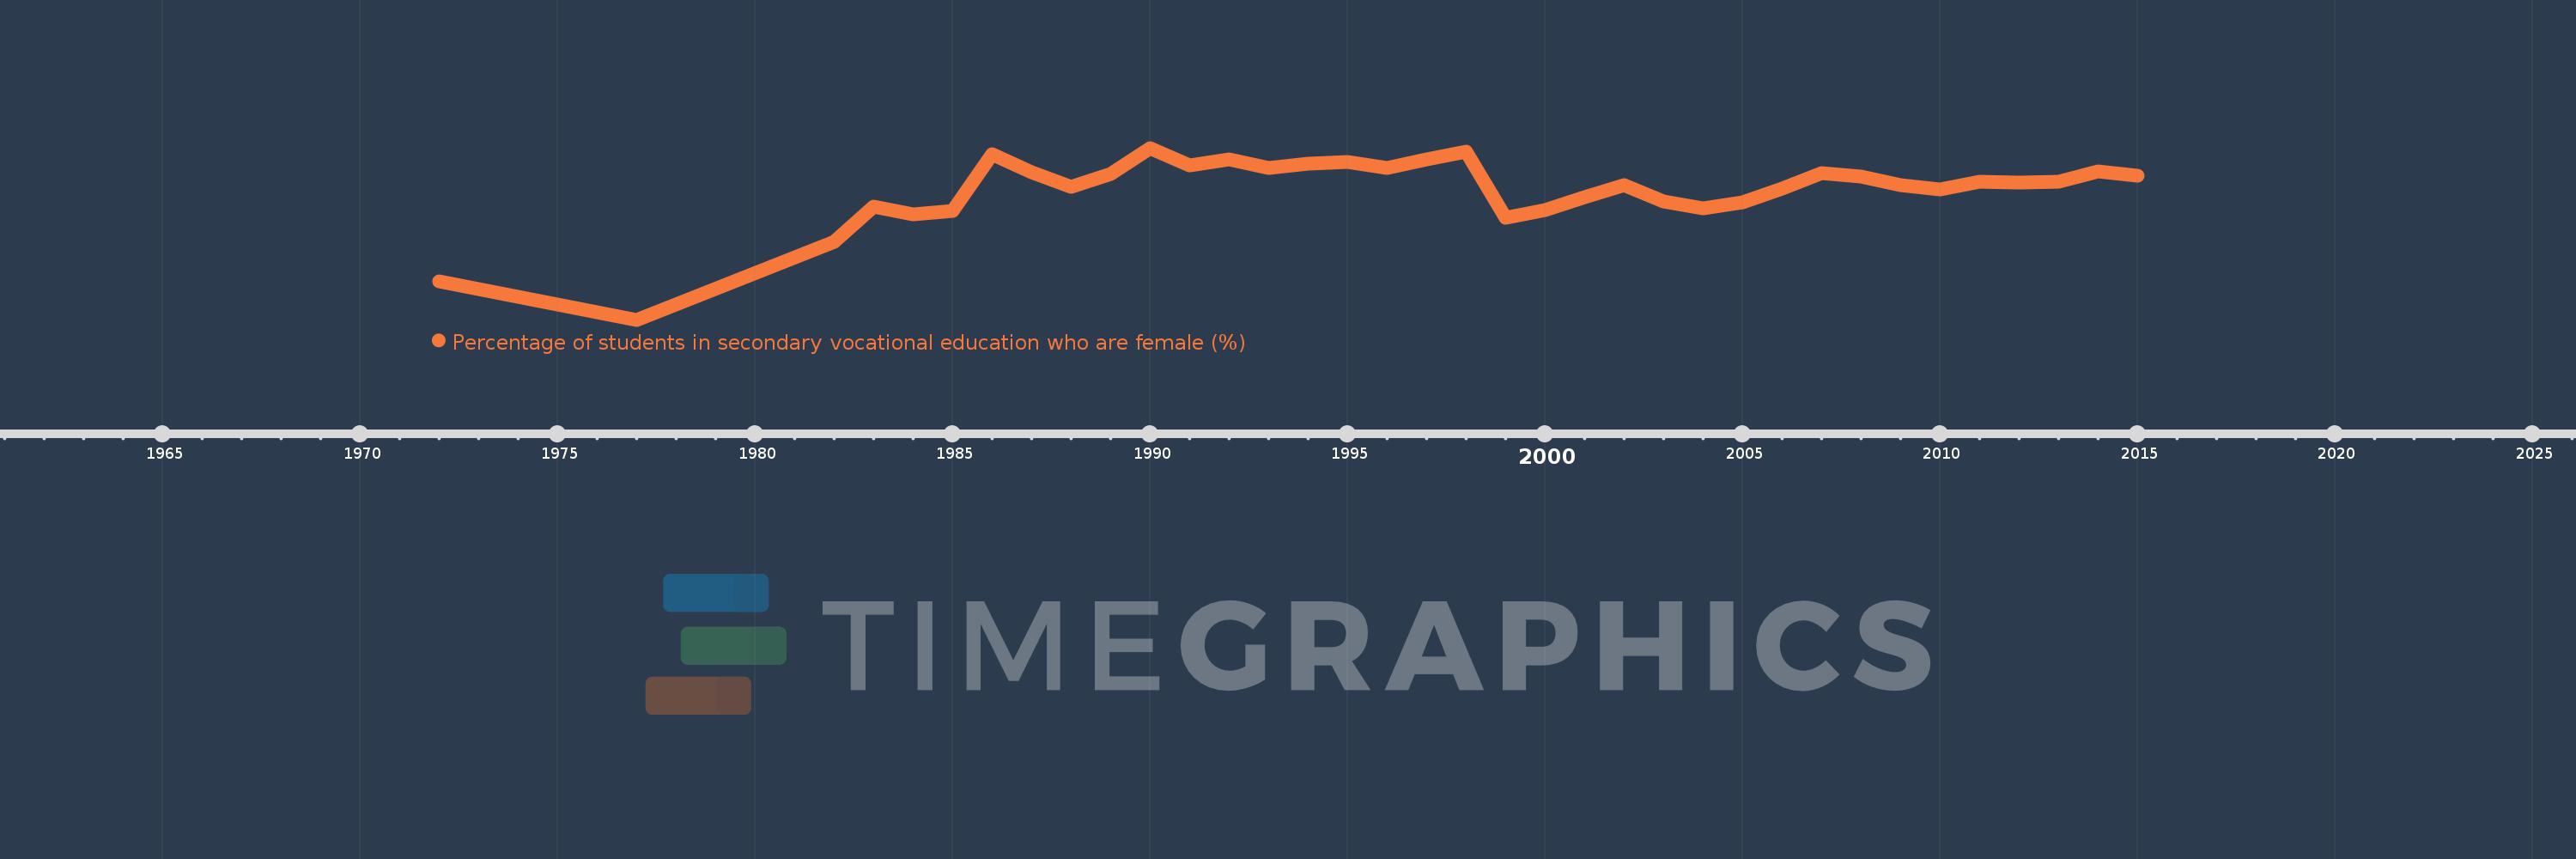
Percentage of students in secondary vocational education who are female (%)
2015,2014,2013,2012,2011,2010,2009,2008,2007,2006,2005,2004,2003,2002,2001,2000,1999,1998,1997,1996,1995,1994,1993,1992,1991,1990,1989,1988,1987,1986,1985,1984,1983,1982,1977,1972
This statistics in other country:
AfghanistanAlbaniaAlgeriaAndorraAngolaAntigua and BarbudaArab WorldArgentinaArmeniaArubaAustraliaAustriaAzerbaijanBahrainBangladeshBarbadosBelarusBelgiumBelizeBeninBermudaBhutanBoliviaBosnia and HerzegovinaBotswanaBrazilBritish Virgin IslandsBrunei DarussalamBulgariaBurkina FasoBurundiCabo VerdeCambodiaCameroonCanadaCaribbean small statesCentral African RepublicCentral Europe and the BalticsChadChileChinaColombiaComorosCongo, Dem. Rep.Congo, Rep.Costa RicaCote d'IvoireCroatiaCubaCuracaoCyprusCzech RepublicDenmarkDjiboutiDominicaDominican RepublicEarly-demographic dividendEast Asia & PacificEast Asia & Pacific (excluding high income)East Asia & Pacific (IDA & IBRD countries)EcuadorEgypt, Arab Rep.El SalvadorEquatorial GuineaEritreaEstoniaEthiopiaEuro areaEurope & Central AsiaEurope & Central Asia (excluding high income)Europe & Central Asia (IDA & IBRD countries)European UnionFijiFinlandFragile and conflict affected situationsFranceGabonGambia, TheGeorgiaGermanyGhanaGibraltarGreeceGrenadaGuatemalaGuineaGuinea-BissauGuyanaHaitiHeavily indebted poor countries (HIPC)High incomeHondurasHong Kong SAR, ChinaHungaryIBRD onlyIcelandIDA & IBRD totalIDA blendIDA onlyIDA totalIndiaIndonesiaIran, Islamic Rep.IraqIrelandIsraelItalyJamaicaJapanJordanKazakhstanKenyaKiribatiKorea, Rep.KuwaitKyrgyz RepublicLao PDRLate-demographic dividendLatin America & Caribbean Latin America & Caribbean (excluding high income)Latin America & the Caribbean (IDA & IBRD countries)LatviaLeast developed countries: UN classificationLebanonLesothoLiberiaLibyaLiechtensteinLithuaniaLow & middle incomeLow incomeLower middle incomeLuxembourgMacao SAR, ChinaMacedonia, FYRMadagascarMalawiMalaysiaMaldivesMaliMaltaMarshall IslandsMauritaniaMauritiusMexicoMicronesia, Fed. Sts.Middle East & North AfricaMiddle East & North Africa (excluding high income)Middle East & North Africa (IDA & IBRD countries)Middle incomeMoldovaMonacoMongoliaMontenegroMoroccoMozambiqueMyanmarNamibiaNauruNepalNetherlandsNew ZealandNicaraguaNigerNigeriaNorth AmericaNorwayOECD membersOmanOther small statesPacific island small statesPakistanPanamaPapua New GuineaParaguayPeruPolandPortugalPost-demographic dividendPre-demographic dividendPuerto RicoQatarRomaniaRussian FederationRwandaSamoaSan MarinoSao Tome and PrincipeSaudi ArabiaSenegalSerbiaSeychellesSierra LeoneSingaporeSint Maarten (Dutch part)Slovak RepublicSloveniaSmall statesSolomon IslandsSomaliaSouth AfricaSouth AsiaSouth Asia (IDA & IBRD)SpainSri LankaSt. Kitts and NevisSt. LuciaSt. Vincent and the GrenadinesSub-Saharan Africa Sub-Saharan Africa (excluding high income)Sub-Saharan Africa (IDA & IBRD countries)SudanSurinameSwazilandSwedenSwitzerlandSyrian Arab RepublicTajikistanTanzaniaThailandTimor-LesteTogoTongaTrinidad and TobagoTunisiaTurkeyTurkmenistanTurks and Caicos IslandsTuvaluUgandaUkraineUnited Arab EmiratesUnited KingdomUpper middle incomeUruguayUzbekistanVanuatuVenezuela, RBVietnamWest Bank and GazaWorldYemen, Rep.ZambiaZimbabwe Timeline:
This timeline shows a graph from 1972 to 2015 of Austria. No data until 1971. Number of actual observations by date: 36.
Source name:
World Development Indicators
Source organization:
UNESCO Institute for Statistics
Categories, topics:
Education, Gender
Last updated:
apr 23, 2017
Indicators value changes by year
Minimum:
39.799
jan 1, 1977
Maximum:
44.953
jan 1, 1990
At the date of observation
Value
Absolute change
Change from previous value
jan 1, 1972
40.961
+40.961
0.0%
jan 1, 1977
39.799
-1.162
-2.84%
jan 1, 1982
42.141
+2.342
5.89%
jan 1, 1983
43.182
+1.041
2.47%
jan 1, 1984
42.97
-0.212
-0.49%
jan 1, 1985
43.064
+0.094
0.22%
jan 1, 1986
44.763
+1.7
3.95%
jan 1, 1987
44.212
-0.551
-1.23%
jan 1, 1988
43.797
-0.415
-0.94%
jan 1, 1989
44.164
+0.367
0.84%
jan 1, 1990
44.953
+0.789
1.79%
jan 1, 1991
44.438
-0.515
-1.15%
jan 1, 1992
44.607
+0.169
0.38%
jan 1, 1993
44.351
-0.256
-0.57%
jan 1, 1994
44.493
+0.142
0.32%
jan 1, 1995
44.545
+0.052
0.12%
jan 1, 1996
44.353
-0.192
-0.43%
jan 1, 1997
44.606
+0.253
0.57%
jan 1, 1998
44.833
+0.227
0.51%
jan 1, 1999
42.861
-1.972
-4.4%
jan 1, 2000
43.084
+0.223
0.52%
jan 1, 2001
43.475
+0.39
0.91%
jan 1, 2002
43.844
+0.369
0.85%
jan 1, 2003
43.342
-0.502
-1.14%
jan 1, 2004
43.144
-0.198
-0.46%
jan 1, 2005
43.33
+0.186
0.43%
jan 1, 2006
43.731
+0.402
0.93%
jan 1, 2007
44.208
+0.477
1.09%
jan 1, 2008
44.093
-0.115
-0.26%
jan 1, 2009
43.849
-0.244
-0.55%
jan 1, 2010
43.696
-0.153
-0.35%
jan 1, 2011
43.94
+0.245
0.56%
jan 1, 2012
43.92
-0.02
-0.05%
jan 1, 2013
43.931
+0.011
0.03%
jan 1, 2014
44.258
+0.327
0.74%
jan 1, 2015
44.119
-0.139
-0.31%
Ranking of countries by current statistics by years


Comments: