29
/
en
AIzaSyAYiBZKx7MnpbEhh9jyipgxe19OcubqV5w
April 1, 2024
153902
Iceland
ISL
true
2
1
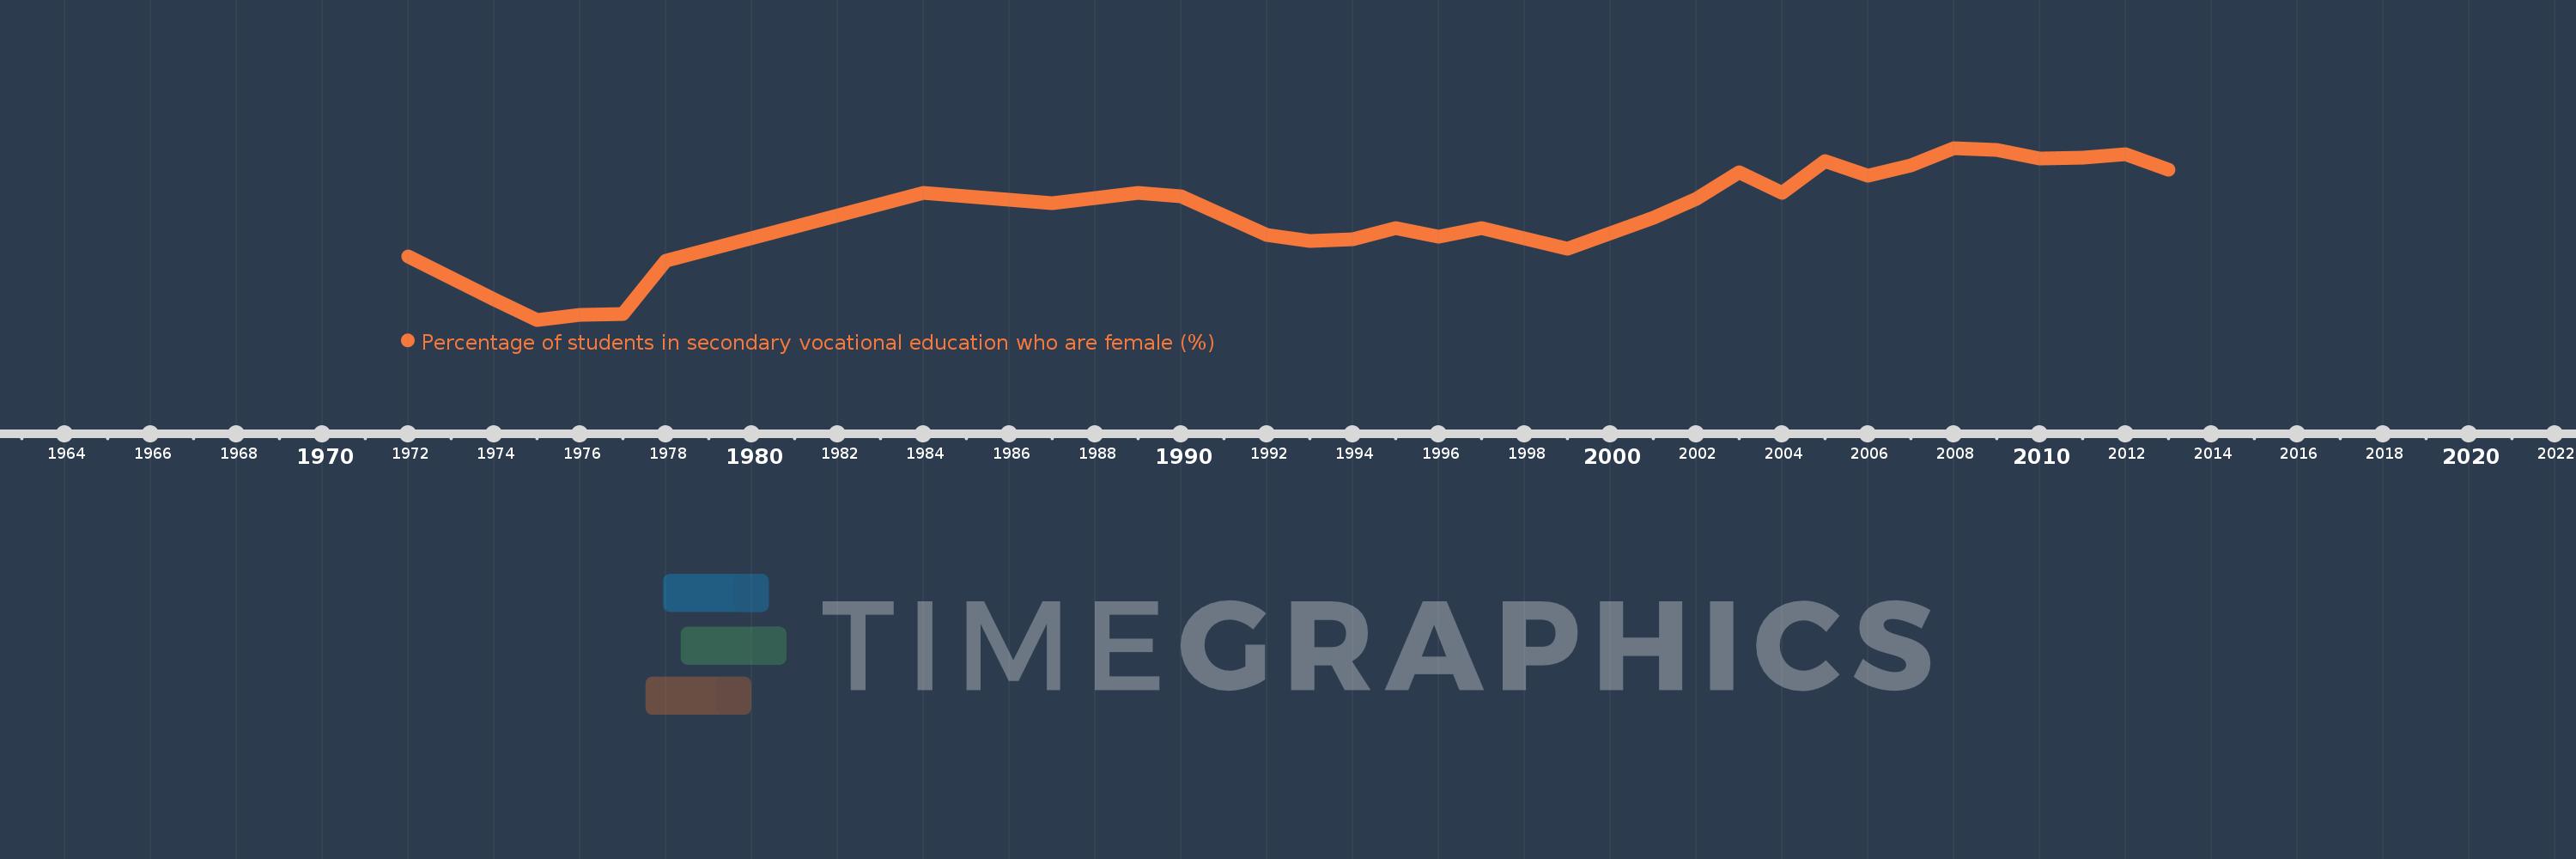
Percentage of students in secondary vocational education who are female (%)
2013,2012,2011,2010,2009,2008,2007,2006,2005,2004,2003,2002,2001,2000,1999,1997,1996,1995,1994,1993,1992,1990,1989,1987,1984,1978,1977,1976,1975,1974,1972
This statistics in other country:
AfghanistanAlbaniaAlgeriaAndorraAngolaAntigua and BarbudaArab WorldArgentinaArmeniaArubaAustraliaAustriaAzerbaijanBahrainBangladeshBarbadosBelarusBelgiumBelizeBeninBermudaBhutanBoliviaBosnia and HerzegovinaBotswanaBrazilBritish Virgin IslandsBrunei DarussalamBulgariaBurkina FasoBurundiCabo VerdeCambodiaCameroonCanadaCaribbean small statesCentral African RepublicCentral Europe and the BalticsChadChileChinaColombiaComorosCongo, Dem. Rep.Congo, Rep.Costa RicaCote d'IvoireCroatiaCubaCuracaoCyprusCzech RepublicDenmarkDjiboutiDominicaDominican RepublicEarly-demographic dividendEast Asia & PacificEast Asia & Pacific (excluding high income)East Asia & Pacific (IDA & IBRD countries)EcuadorEgypt, Arab Rep.El SalvadorEquatorial GuineaEritreaEstoniaEthiopiaEuro areaEurope & Central AsiaEurope & Central Asia (excluding high income)Europe & Central Asia (IDA & IBRD countries)European UnionFijiFinlandFragile and conflict affected situationsFranceGabonGambia, TheGeorgiaGermanyGhanaGibraltarGreeceGrenadaGuatemalaGuineaGuinea-BissauGuyanaHaitiHeavily indebted poor countries (HIPC)High incomeHondurasHong Kong SAR, ChinaHungaryIBRD onlyIcelandIDA & IBRD totalIDA blendIDA onlyIDA totalIndiaIndonesiaIran, Islamic Rep.IraqIrelandIsraelItalyJamaicaJapanJordanKazakhstanKenyaKiribatiKorea, Rep.KuwaitKyrgyz RepublicLao PDRLate-demographic dividendLatin America & Caribbean Latin America & Caribbean (excluding high income)Latin America & the Caribbean (IDA & IBRD countries)LatviaLeast developed countries: UN classificationLebanonLesothoLiberiaLibyaLiechtensteinLithuaniaLow & middle incomeLow incomeLower middle incomeLuxembourgMacao SAR, ChinaMacedonia, FYRMadagascarMalawiMalaysiaMaldivesMaliMaltaMarshall IslandsMauritaniaMauritiusMexicoMicronesia, Fed. Sts.Middle East & North AfricaMiddle East & North Africa (excluding high income)Middle East & North Africa (IDA & IBRD countries)Middle incomeMoldovaMonacoMongoliaMontenegroMoroccoMozambiqueMyanmarNamibiaNauruNepalNetherlandsNew ZealandNicaraguaNigerNigeriaNorth AmericaNorwayOECD membersOmanOther small statesPacific island small statesPakistanPanamaPapua New GuineaParaguayPeruPolandPortugalPost-demographic dividendPre-demographic dividendPuerto RicoQatarRomaniaRussian FederationRwandaSamoaSan MarinoSao Tome and PrincipeSaudi ArabiaSenegalSerbiaSeychellesSierra LeoneSingaporeSint Maarten (Dutch part)Slovak RepublicSloveniaSmall statesSolomon IslandsSomaliaSouth AfricaSouth AsiaSouth Asia (IDA & IBRD)SpainSri LankaSt. Kitts and NevisSt. LuciaSt. Vincent and the GrenadinesSub-Saharan Africa Sub-Saharan Africa (excluding high income)Sub-Saharan Africa (IDA & IBRD countries)SudanSurinameSwazilandSwedenSwitzerlandSyrian Arab RepublicTajikistanTanzaniaThailandTimor-LesteTogoTongaTrinidad and TobagoTunisiaTurkeyTurkmenistanTurks and Caicos IslandsTuvaluUgandaUkraineUnited Arab EmiratesUnited KingdomUpper middle incomeUruguayUzbekistanVanuatuVenezuela, RBVietnamWest Bank and GazaWorldYemen, Rep.ZambiaZimbabwe Timeline:
This timeline shows a graph from 1972 to 2013 of Iceland. No data until 1971. Number of actual observations by date: 31.
Source name:
World Development Indicators
Source organization:
UNESCO Institute for Statistics
Categories, topics:
Education, Gender
Last updated:
apr 23, 2017
Indicators value changes by year
Minimum:
26.027
jan 1, 1975
Maximum:
42.608
jan 1, 2008
At the date of observation
Value
Absolute change
Change from previous value
jan 1, 1972
32.13
+32.13
0.0%
jan 1, 1974
28.005
-4.126
-12.84%
jan 1, 1975
26.027
-1.978
-7.06%
jan 1, 1976
26.486
+0.459
1.76%
jan 1, 1977
26.56
+0.074
0.28%
jan 1, 1978
31.731
+5.171
19.47%
jan 1, 1984
38.28
+6.549
20.64%
jan 1, 1987
37.282
-0.998
-2.61%
jan 1, 1989
38.248
+0.966
2.59%
jan 1, 1990
37.963
-0.285
-0.74%
jan 1, 1992
34.23
-3.734
-9.83%
jan 1, 1993
33.658
-0.572
-1.67%
jan 1, 1994
33.777
+0.119
0.35%
jan 1, 1995
34.835
+1.058
3.13%
jan 1, 1996
34.084
-0.751
-2.15%
jan 1, 1997
34.857
+0.773
2.27%
jan 1, 1999
32.868
-1.99
-5.71%
jan 1, 2000
34.384
+1.517
4.61%
jan 1, 2001
35.888
+1.504
4.37%
jan 1, 2002
37.656
+1.768
4.93%
jan 1, 2003
40.265
+2.609
6.93%
jan 1, 2004
38.274
-1.99
-4.94%
jan 1, 2005
41.356
+3.082
8.05%
jan 1, 2006
39.912
-1.445
-3.49%
jan 1, 2007
40.954
+1.042
2.61%
jan 1, 2008
42.608
+1.655
4.04%
jan 1, 2009
42.404
-0.204
-0.48%
jan 1, 2010
41.624
-0.78
-1.84%
jan 1, 2011
41.712
+0.088
0.21%
jan 1, 2012
41.971
+0.259
0.62%
jan 1, 2013
40.5
-1.471
-3.51%
Ranking of countries by current statistics by years


Comments: