29
/
en
AIzaSyAYiBZKx7MnpbEhh9jyipgxe19OcubqV5w
April 1, 2024
31982
Europe & Central Asia (excluding high income)
ECA
false
2
1
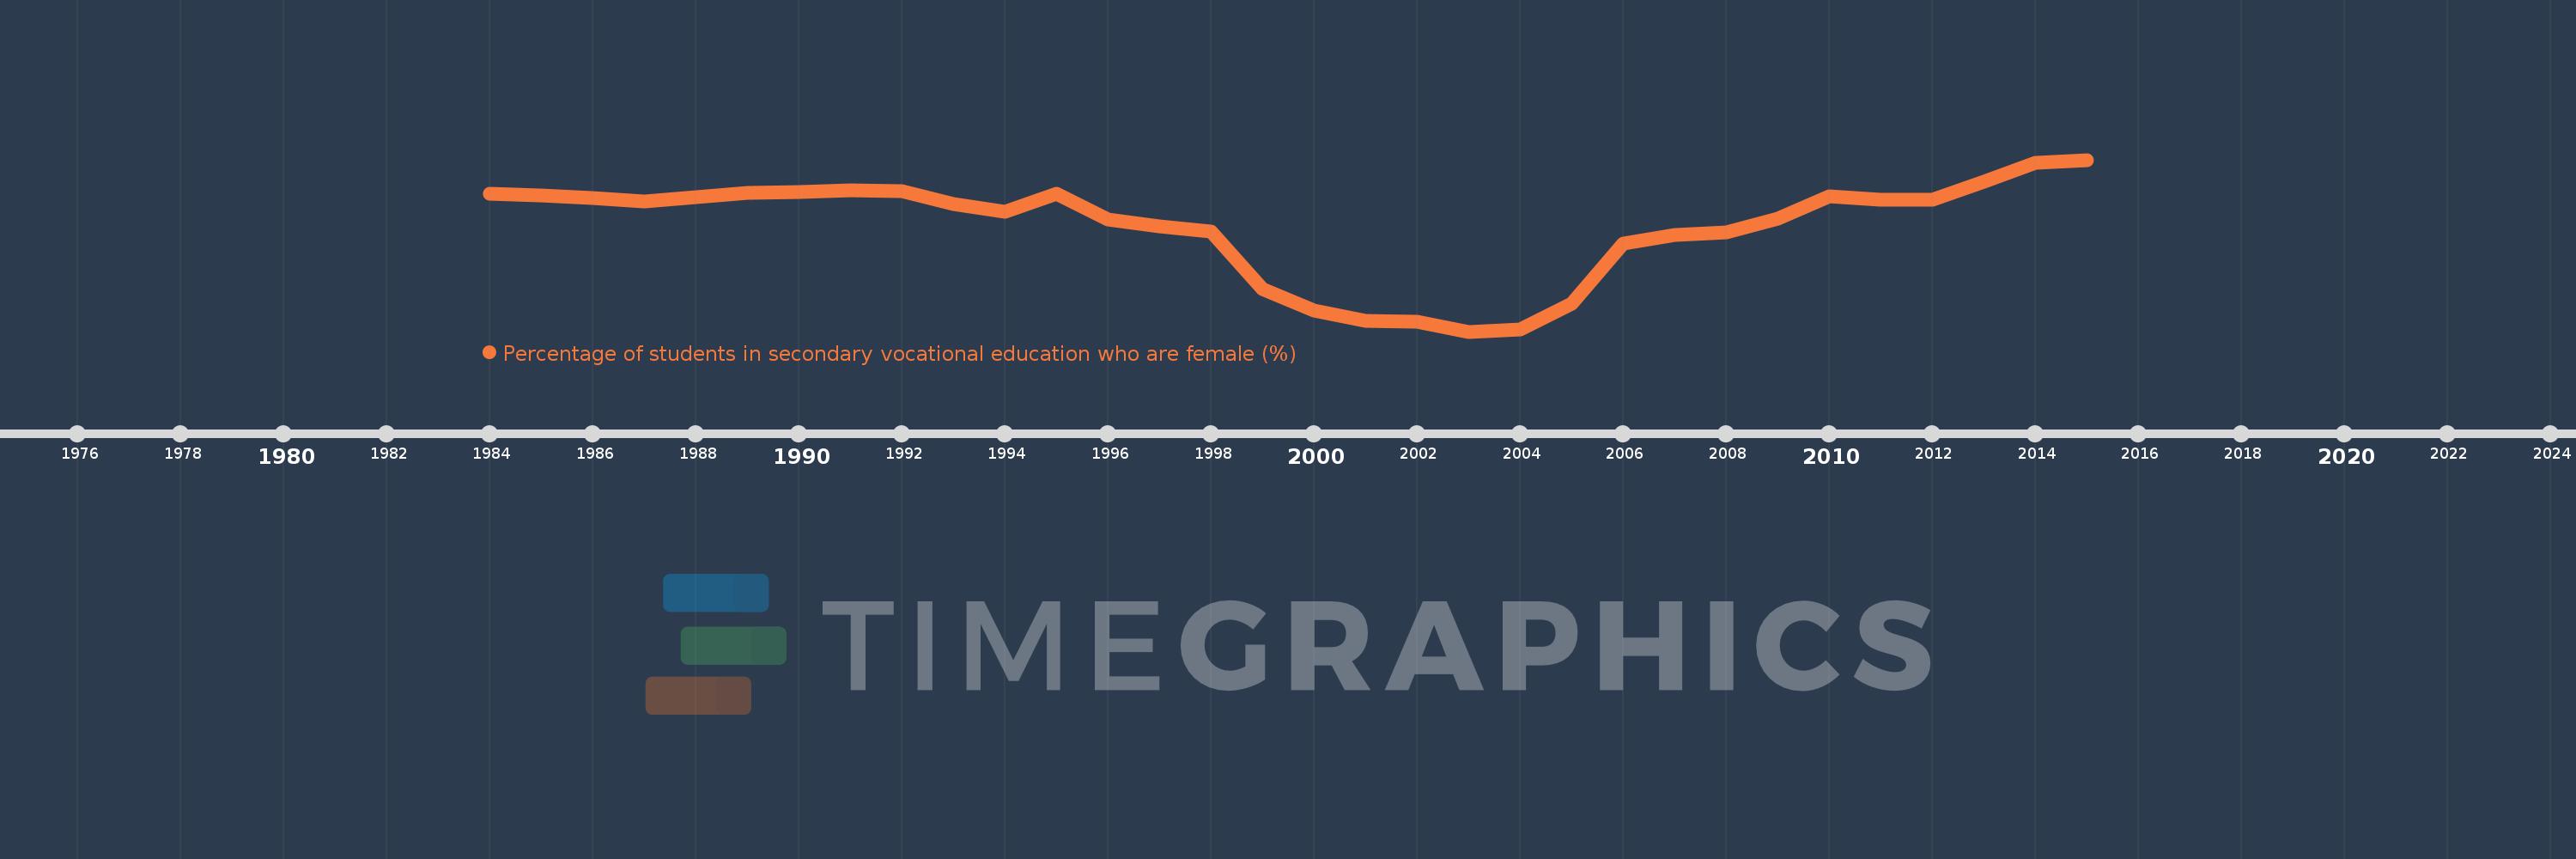
Percentage of students in secondary vocational education who are female (%)
2015,2014,2013,2012,2011,2010,2009,2008,2007,2006,2005,2004,2003,2002,2001,2000,1999,1998,1997,1996,1995,1994,1993,1992,1991,1990,1989,1988,1987,1986,1985,1984
This statistics in other country:
AfghanistanAlbaniaAlgeriaAndorraAngolaAntigua and BarbudaArab WorldArgentinaArmeniaArubaAustraliaAustriaAzerbaijanBahrainBangladeshBarbadosBelarusBelgiumBelizeBeninBermudaBhutanBoliviaBosnia and HerzegovinaBotswanaBrazilBritish Virgin IslandsBrunei DarussalamBulgariaBurkina FasoBurundiCabo VerdeCambodiaCameroonCanadaCaribbean small statesCentral African RepublicCentral Europe and the BalticsChadChileChinaColombiaComorosCongo, Dem. Rep.Congo, Rep.Costa RicaCote d'IvoireCroatiaCubaCuracaoCyprusCzech RepublicDenmarkDjiboutiDominicaDominican RepublicEarly-demographic dividendEast Asia & PacificEast Asia & Pacific (excluding high income)East Asia & Pacific (IDA & IBRD countries)EcuadorEgypt, Arab Rep.El SalvadorEquatorial GuineaEritreaEstoniaEthiopiaEuro areaEurope & Central AsiaEurope & Central Asia (excluding high income)Europe & Central Asia (IDA & IBRD countries)European UnionFijiFinlandFragile and conflict affected situationsFranceGabonGambia, TheGeorgiaGermanyGhanaGibraltarGreeceGrenadaGuatemalaGuineaGuinea-BissauGuyanaHaitiHeavily indebted poor countries (HIPC)High incomeHondurasHong Kong SAR, ChinaHungaryIBRD onlyIcelandIDA & IBRD totalIDA blendIDA onlyIDA totalIndiaIndonesiaIran, Islamic Rep.IraqIrelandIsraelItalyJamaicaJapanJordanKazakhstanKenyaKiribatiKorea, Rep.KuwaitKyrgyz RepublicLao PDRLate-demographic dividendLatin America & Caribbean Latin America & Caribbean (excluding high income)Latin America & the Caribbean (IDA & IBRD countries)LatviaLeast developed countries: UN classificationLebanonLesothoLiberiaLibyaLiechtensteinLithuaniaLow & middle incomeLow incomeLower middle incomeLuxembourgMacao SAR, ChinaMacedonia, FYRMadagascarMalawiMalaysiaMaldivesMaliMaltaMarshall IslandsMauritaniaMauritiusMexicoMicronesia, Fed. Sts.Middle East & North AfricaMiddle East & North Africa (excluding high income)Middle East & North Africa (IDA & IBRD countries)Middle incomeMoldovaMonacoMongoliaMontenegroMoroccoMozambiqueMyanmarNamibiaNauruNepalNetherlandsNew ZealandNicaraguaNigerNigeriaNorth AmericaNorwayOECD membersOmanOther small statesPacific island small statesPakistanPanamaPapua New GuineaParaguayPeruPolandPortugalPost-demographic dividendPre-demographic dividendPuerto RicoQatarRomaniaRussian FederationRwandaSamoaSan MarinoSao Tome and PrincipeSaudi ArabiaSenegalSerbiaSeychellesSierra LeoneSingaporeSint Maarten (Dutch part)Slovak RepublicSloveniaSmall statesSolomon IslandsSomaliaSouth AfricaSouth AsiaSouth Asia (IDA & IBRD)SpainSri LankaSt. Kitts and NevisSt. LuciaSt. Vincent and the GrenadinesSub-Saharan Africa Sub-Saharan Africa (excluding high income)Sub-Saharan Africa (IDA & IBRD countries)SudanSurinameSwazilandSwedenSwitzerlandSyrian Arab RepublicTajikistanTanzaniaThailandTimor-LesteTogoTongaTrinidad and TobagoTunisiaTurkeyTurkmenistanTurks and Caicos IslandsTuvaluUgandaUkraineUnited Arab EmiratesUnited KingdomUpper middle incomeUruguayUzbekistanVanuatuVenezuela, RBVietnamWest Bank and GazaWorldYemen, Rep.ZambiaZimbabwe Timeline:
This timeline shows a graph from 1984 to 2015 of Europe & Central Asia (excluding high income). No data until 1983. Number of actual observations by date: 32.
Source name:
World Development Indicators
Source organization:
UNESCO Institute for Statistics
Categories, topics:
Education, Gender
Last updated:
apr 23, 2017
Indicators value changes by year
Maximum:
43.287
jan 1, 2015
At the date of observation
Value
Absolute change
Change from previous value
jan 1, 1984
42.096
+42.096
0.0%
jan 1, 1985
42.03
-0.066
-0.16%
jan 1, 1986
41.943
-0.087
-0.21%
jan 1, 1987
41.842
-0.101
-0.24%
jan 1, 1988
41.993
+0.151
0.36%
jan 1, 1989
42.13
+0.137
0.33%
jan 1, 1990
42.16
+0.03
0.07%
jan 1, 1991
42.228
+0.068
0.16%
jan 1, 1992
42.187
-0.041
-0.1%
jan 1, 1993
41.747
-0.44
-1.04%
jan 1, 1994
41.472
-0.276
-0.66%
jan 1, 1995
42.097
+0.625
1.51%
jan 1, 1996
41.212
-0.885
-2.1%
jan 1, 1997
40.973
-0.239
-0.58%
jan 1, 1998
40.79
-0.182
-0.45%
jan 1, 1999
38.788
-2.003
-4.91%
jan 1, 2000
38.026
-0.762
-1.96%
jan 1, 2001
37.675
-0.351
-0.92%
jan 1, 2002
37.63
-0.046
-0.12%
jan 1, 2003
37.29
-0.339
-0.9%
jan 1, 2004
37.352
+0.062
0.17%
jan 1, 2005
38.264
+0.912
2.44%
jan 1, 2006
40.356
+2.091
5.47%
jan 1, 2007
40.658
+0.303
0.75%
jan 1, 2008
40.753
+0.095
0.23%
jan 1, 2009
41.23
+0.476
1.17%
jan 1, 2010
42.01
+0.78
1.89%
jan 1, 2011
41.891
-0.119
-0.28%
jan 1, 2012
41.906
+0.015
0.04%
jan 1, 2013
42.515
+0.609
1.45%
jan 1, 2014
43.172
+0.657
1.55%
jan 1, 2015
43.287
+0.115
0.27%
Ranking of countries by current statistics by years


Comments: