29
/
en
AIzaSyAYiBZKx7MnpbEhh9jyipgxe19OcubqV5w
April 1, 2024
49381
Middle East & North Africa (excluding high income)
MNA
false
2
1
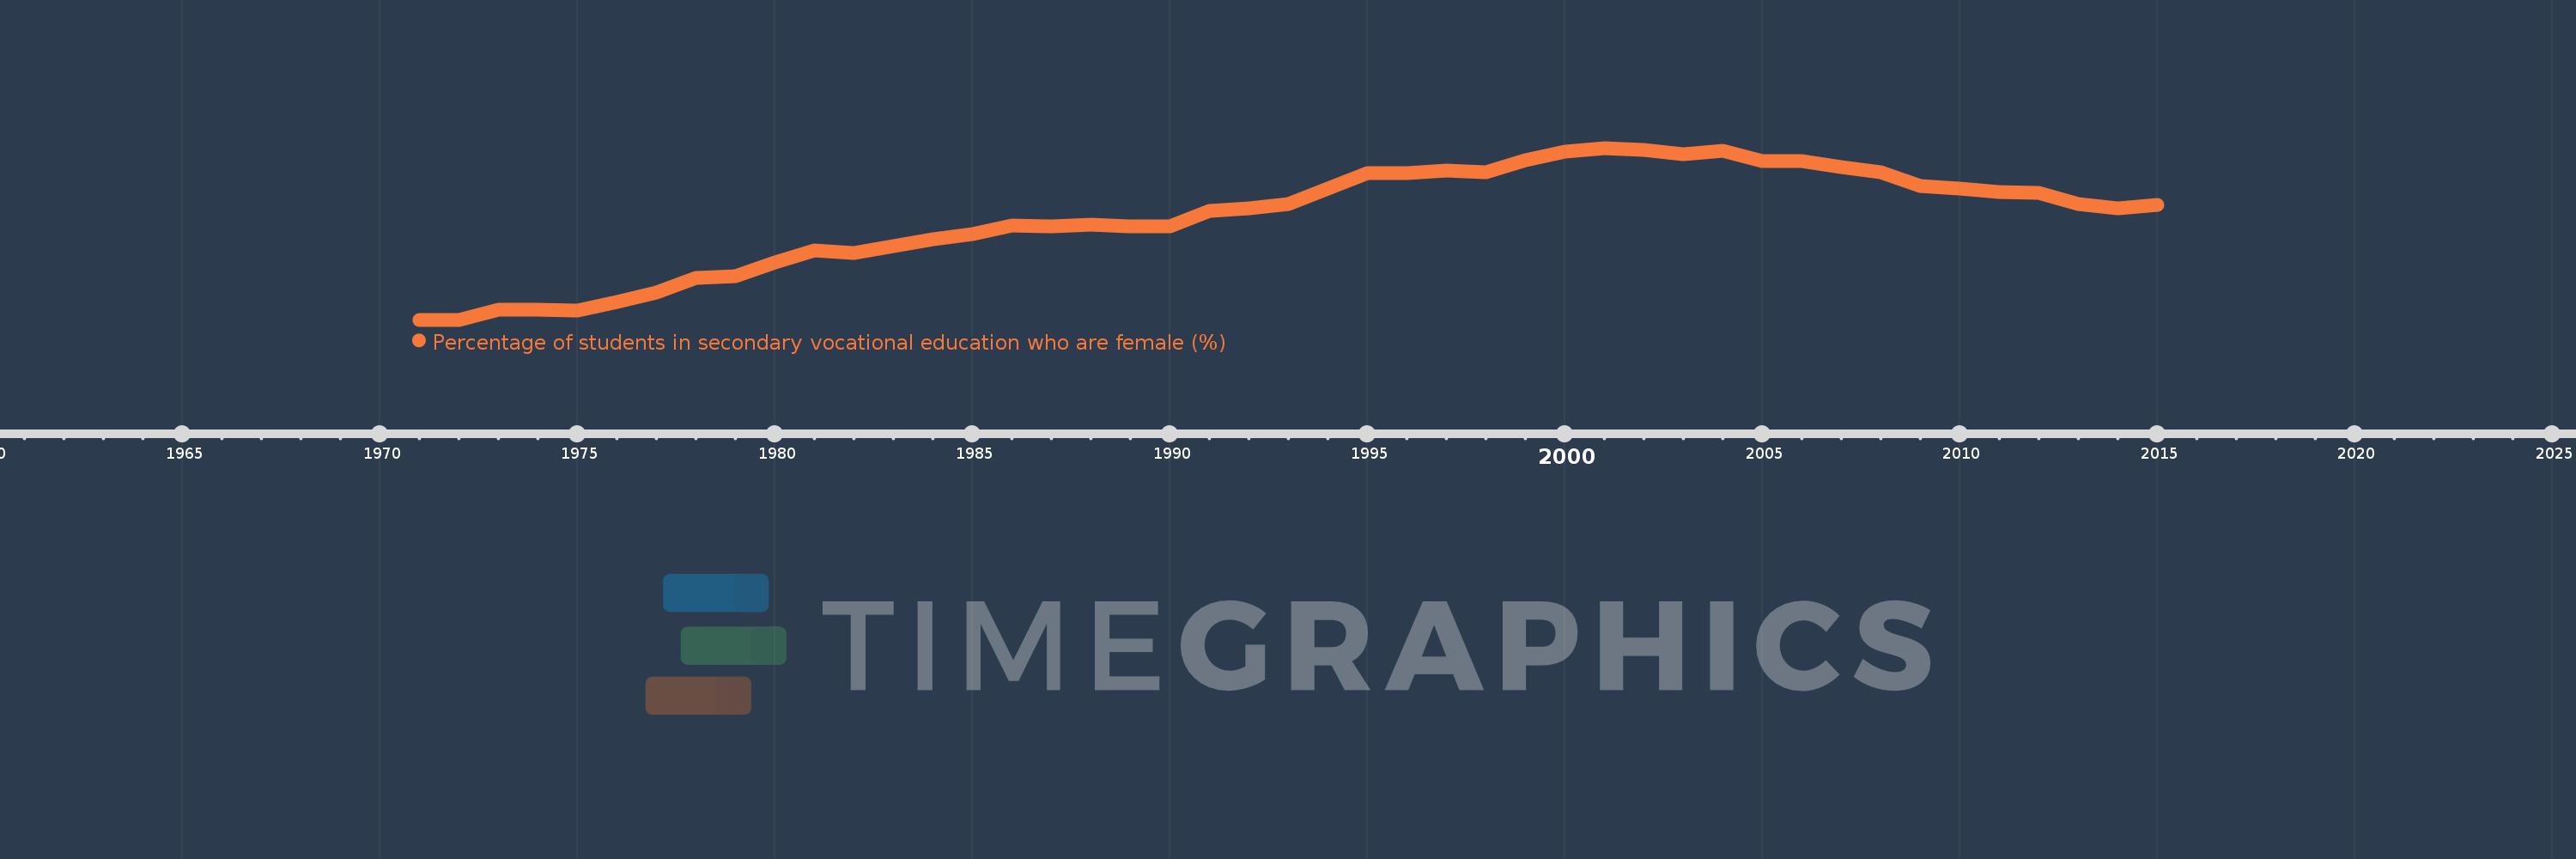
Percentage of students in secondary vocational education who are female (%)
2015,2014,2013,2012,2011,2010,2009,2008,2007,2006,2005,2004,2003,2002,2001,2000,1999,1998,1997,1996,1995,1994,1993,1992,1991,1990,1989,1988,1987,1986,1985,1984,1983,1982,1981,1980,1979,1978,1977,1976,1975,1974,1973,1972,1971
This statistics in other country:
AfghanistanAlbaniaAlgeriaAndorraAngolaAntigua and BarbudaArab WorldArgentinaArmeniaArubaAustraliaAustriaAzerbaijanBahrainBangladeshBarbadosBelarusBelgiumBelizeBeninBermudaBhutanBoliviaBosnia and HerzegovinaBotswanaBrazilBritish Virgin IslandsBrunei DarussalamBulgariaBurkina FasoBurundiCabo VerdeCambodiaCameroonCanadaCaribbean small statesCentral African RepublicCentral Europe and the BalticsChadChileChinaColombiaComorosCongo, Dem. Rep.Congo, Rep.Costa RicaCote d'IvoireCroatiaCubaCuracaoCyprusCzech RepublicDenmarkDjiboutiDominicaDominican RepublicEarly-demographic dividendEast Asia & PacificEast Asia & Pacific (excluding high income)East Asia & Pacific (IDA & IBRD countries)EcuadorEgypt, Arab Rep.El SalvadorEquatorial GuineaEritreaEstoniaEthiopiaEuro areaEurope & Central AsiaEurope & Central Asia (excluding high income)Europe & Central Asia (IDA & IBRD countries)European UnionFijiFinlandFragile and conflict affected situationsFranceGabonGambia, TheGeorgiaGermanyGhanaGibraltarGreeceGrenadaGuatemalaGuineaGuinea-BissauGuyanaHaitiHeavily indebted poor countries (HIPC)High incomeHondurasHong Kong SAR, ChinaHungaryIBRD onlyIcelandIDA & IBRD totalIDA blendIDA onlyIDA totalIndiaIndonesiaIran, Islamic Rep.IraqIrelandIsraelItalyJamaicaJapanJordanKazakhstanKenyaKiribatiKorea, Rep.KuwaitKyrgyz RepublicLao PDRLate-demographic dividendLatin America & Caribbean Latin America & Caribbean (excluding high income)Latin America & the Caribbean (IDA & IBRD countries)LatviaLeast developed countries: UN classificationLebanonLesothoLiberiaLibyaLiechtensteinLithuaniaLow & middle incomeLow incomeLower middle incomeLuxembourgMacao SAR, ChinaMacedonia, FYRMadagascarMalawiMalaysiaMaldivesMaliMaltaMarshall IslandsMauritaniaMauritiusMexicoMicronesia, Fed. Sts.Middle East & North AfricaMiddle East & North Africa (excluding high income)Middle East & North Africa (IDA & IBRD countries)Middle incomeMoldovaMonacoMongoliaMontenegroMoroccoMozambiqueMyanmarNamibiaNauruNepalNetherlandsNew ZealandNicaraguaNigerNigeriaNorth AmericaNorwayOECD membersOmanOther small statesPacific island small statesPakistanPanamaPapua New GuineaParaguayPeruPolandPortugalPost-demographic dividendPre-demographic dividendPuerto RicoQatarRomaniaRussian FederationRwandaSamoaSan MarinoSao Tome and PrincipeSaudi ArabiaSenegalSerbiaSeychellesSierra LeoneSingaporeSint Maarten (Dutch part)Slovak RepublicSloveniaSmall statesSolomon IslandsSomaliaSouth AfricaSouth AsiaSouth Asia (IDA & IBRD)SpainSri LankaSt. Kitts and NevisSt. LuciaSt. Vincent and the GrenadinesSub-Saharan Africa Sub-Saharan Africa (excluding high income)Sub-Saharan Africa (IDA & IBRD countries)SudanSurinameSwazilandSwedenSwitzerlandSyrian Arab RepublicTajikistanTanzaniaThailandTimor-LesteTogoTongaTrinidad and TobagoTunisiaTurkeyTurkmenistanTurks and Caicos IslandsTuvaluUgandaUkraineUnited Arab EmiratesUnited KingdomUpper middle incomeUruguayUzbekistanVanuatuVenezuela, RBVietnamWest Bank and GazaWorldYemen, Rep.ZambiaZimbabwe Timeline:
This timeline shows a graph from 1971 to 2015 of Middle East & North Africa (excluding high income). No data until 1970. Number of actual observations by date: 45.
Source name:
World Development Indicators
Source organization:
UNESCO Institute for Statistics
Categories, topics:
Education, Gender
Last updated:
apr 23, 2017
Indicators value changes by year
Minimum:
29.752
jan 1, 1971
Maximum:
43.368
jan 1, 2001
At the date of observation
Value
Absolute change
Change from previous value
jan 1, 1971
29.752
+29.752
0.0%
jan 1, 1972
29.754
+0.002
0.01%
jan 1, 1973
30.527
+0.773
2.6%
jan 1, 1974
30.552
+0.026
0.08%
jan 1, 1975
30.492
-0.06
-0.2%
jan 1, 1976
31.155
+0.663
2.17%
jan 1, 1977
31.944
+0.79
2.53%
jan 1, 1978
33.059
+1.114
3.49%
jan 1, 1979
33.222
+0.163
0.49%
jan 1, 1980
34.29
+1.068
3.22%
jan 1, 1981
35.28
+0.99
2.89%
jan 1, 1982
35.071
-0.209
-0.59%
jan 1, 1983
35.617
+0.546
1.56%
jan 1, 1984
36.141
+0.524
1.47%
jan 1, 1985
36.51
+0.369
1.02%
jan 1, 1986
37.214
+0.703
1.93%
jan 1, 1987
37.173
-0.041
-0.11%
jan 1, 1988
37.282
+0.109
0.29%
jan 1, 1989
37.122
-0.16
-0.43%
jan 1, 1990
37.133
+0.011
0.03%
jan 1, 1991
38.347
+1.214
3.27%
jan 1, 1992
38.575
+0.228
0.59%
jan 1, 1993
38.922
+0.347
0.9%
jan 1, 1994
40.144
+1.221
3.14%
jan 1, 1995
41.363
+1.219
3.04%
jan 1, 1996
41.353
-0.01
-0.02%
jan 1, 1997
41.594
+0.242
0.58%
jan 1, 1998
41.438
-0.156
-0.38%
jan 1, 1999
42.396
+0.958
2.31%
jan 1, 2000
43.076
+0.68
1.61%
jan 1, 2001
43.368
+0.292
0.68%
jan 1, 2002
43.243
-0.125
-0.29%
jan 1, 2003
42.877
-0.366
-0.85%
jan 1, 2004
43.163
+0.286
0.67%
jan 1, 2005
42.334
-0.83
-1.92%
jan 1, 2006
42.295
-0.038
-0.09%
jan 1, 2007
41.834
-0.461
-1.09%
jan 1, 2008
41.454
-0.38
-0.91%
jan 1, 2009
40.349
-1.105
-2.67%
jan 1, 2010
40.114
-0.234
-0.58%
jan 1, 2011
39.875
-0.239
-0.6%
jan 1, 2012
39.804
-0.071
-0.18%
jan 1, 2013
38.924
-0.88
-2.21%
jan 1, 2014
38.548
-0.376
-0.97%
jan 1, 2015
38.873
+0.325
0.84%
Ranking of countries by current statistics by years


Comments: