29
/
en
AIzaSyAYiBZKx7MnpbEhh9jyipgxe19OcubqV5w
April 1, 2024
41802
Latin America & Caribbean
LCN
false
2
1
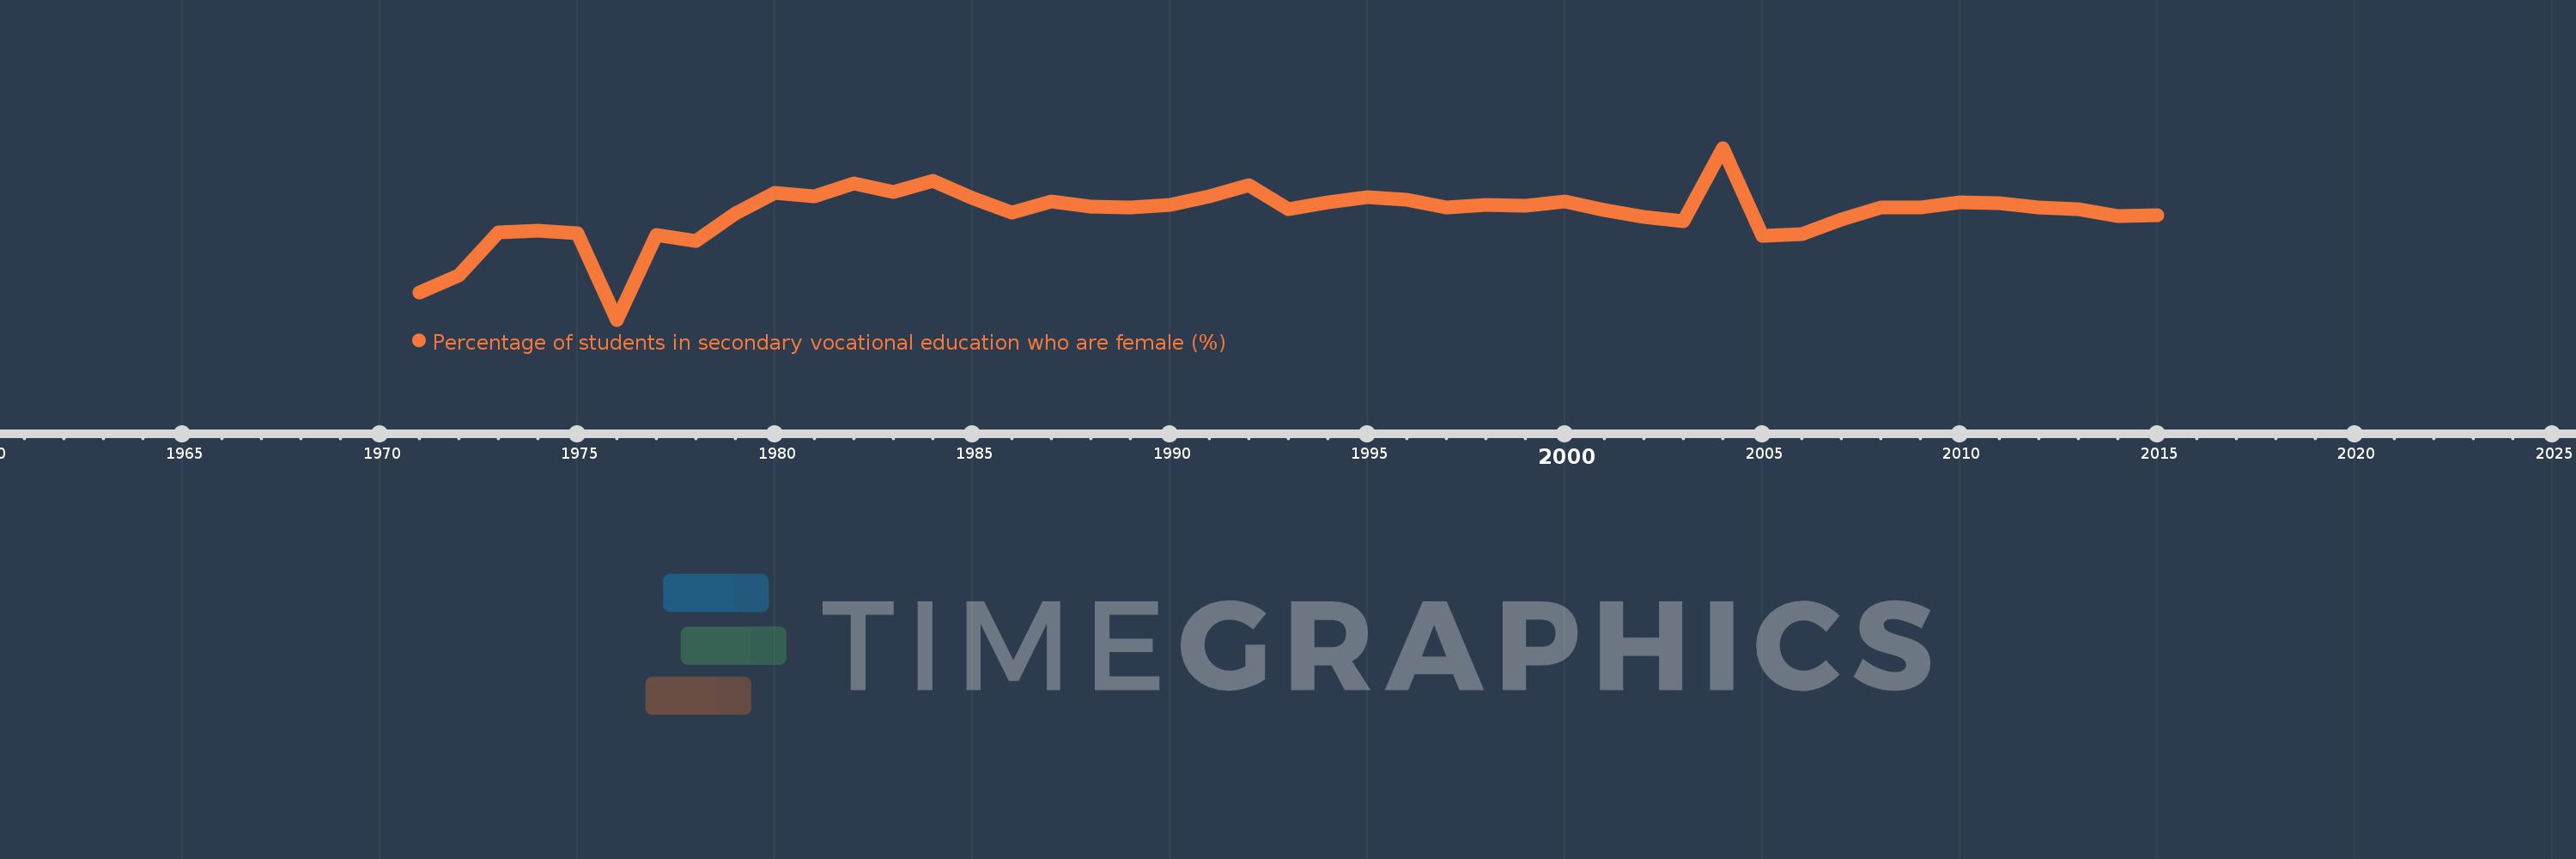
Percentage of students in secondary vocational education who are female (%)
2015,2014,2013,2012,2011,2010,2009,2008,2007,2006,2005,2004,2003,2002,2001,2000,1999,1998,1997,1996,1995,1994,1993,1992,1991,1990,1989,1988,1987,1986,1985,1984,1983,1982,1981,1980,1979,1978,1977,1976,1975,1974,1973,1972,1971
This statistics in other country:
AfghanistanAlbaniaAlgeriaAndorraAngolaAntigua and BarbudaArab WorldArgentinaArmeniaArubaAustraliaAustriaAzerbaijanBahrainBangladeshBarbadosBelarusBelgiumBelizeBeninBermudaBhutanBoliviaBosnia and HerzegovinaBotswanaBrazilBritish Virgin IslandsBrunei DarussalamBulgariaBurkina FasoBurundiCabo VerdeCambodiaCameroonCanadaCaribbean small statesCentral African RepublicCentral Europe and the BalticsChadChileChinaColombiaComorosCongo, Dem. Rep.Congo, Rep.Costa RicaCote d'IvoireCroatiaCubaCuracaoCyprusCzech RepublicDenmarkDjiboutiDominicaDominican RepublicEarly-demographic dividendEast Asia & PacificEast Asia & Pacific (excluding high income)East Asia & Pacific (IDA & IBRD countries)EcuadorEgypt, Arab Rep.El SalvadorEquatorial GuineaEritreaEstoniaEthiopiaEuro areaEurope & Central AsiaEurope & Central Asia (excluding high income)Europe & Central Asia (IDA & IBRD countries)European UnionFijiFinlandFragile and conflict affected situationsFranceGabonGambia, TheGeorgiaGermanyGhanaGibraltarGreeceGrenadaGuatemalaGuineaGuinea-BissauGuyanaHaitiHeavily indebted poor countries (HIPC)High incomeHondurasHong Kong SAR, ChinaHungaryIBRD onlyIcelandIDA & IBRD totalIDA blendIDA onlyIDA totalIndiaIndonesiaIran, Islamic Rep.IraqIrelandIsraelItalyJamaicaJapanJordanKazakhstanKenyaKiribatiKorea, Rep.KuwaitKyrgyz RepublicLao PDRLate-demographic dividendLatin America & Caribbean Latin America & Caribbean (excluding high income)Latin America & the Caribbean (IDA & IBRD countries)LatviaLeast developed countries: UN classificationLebanonLesothoLiberiaLibyaLiechtensteinLithuaniaLow & middle incomeLow incomeLower middle incomeLuxembourgMacao SAR, ChinaMacedonia, FYRMadagascarMalawiMalaysiaMaldivesMaliMaltaMarshall IslandsMauritaniaMauritiusMexicoMicronesia, Fed. Sts.Middle East & North AfricaMiddle East & North Africa (excluding high income)Middle East & North Africa (IDA & IBRD countries)Middle incomeMoldovaMonacoMongoliaMontenegroMoroccoMozambiqueMyanmarNamibiaNauruNepalNetherlandsNew ZealandNicaraguaNigerNigeriaNorth AmericaNorwayOECD membersOmanOther small statesPacific island small statesPakistanPanamaPapua New GuineaParaguayPeruPolandPortugalPost-demographic dividendPre-demographic dividendPuerto RicoQatarRomaniaRussian FederationRwandaSamoaSan MarinoSao Tome and PrincipeSaudi ArabiaSenegalSerbiaSeychellesSierra LeoneSingaporeSint Maarten (Dutch part)Slovak RepublicSloveniaSmall statesSolomon IslandsSomaliaSouth AfricaSouth AsiaSouth Asia (IDA & IBRD)SpainSri LankaSt. Kitts and NevisSt. LuciaSt. Vincent and the GrenadinesSub-Saharan Africa Sub-Saharan Africa (excluding high income)Sub-Saharan Africa (IDA & IBRD countries)SudanSurinameSwazilandSwedenSwitzerlandSyrian Arab RepublicTajikistanTanzaniaThailandTimor-LesteTogoTongaTrinidad and TobagoTunisiaTurkeyTurkmenistanTurks and Caicos IslandsTuvaluUgandaUkraineUnited Arab EmiratesUnited KingdomUpper middle incomeUruguayUzbekistanVanuatuVenezuela, RBVietnamWest Bank and GazaWorldYemen, Rep.ZambiaZimbabwe Timeline:
This timeline shows a graph from 1971 to 2015 of Latin America & Caribbean . No data until 1970. Number of actual observations by date: 45.
Source name:
World Development Indicators
Source organization:
UNESCO Institute for Statistics
Categories, topics:
Education, Gender
Last updated:
apr 23, 2017
Indicators value changes by year
Minimum:
48.556
jan 1, 1976
Maximum:
56.209
jan 1, 2004
At the date of observation
Value
Absolute change
Change from previous value
jan 1, 1971
49.776
+49.776
0.0%
jan 1, 1972
50.539
+0.762
1.53%
jan 1, 1973
52.429
+1.891
3.74%
jan 1, 1974
52.543
+0.114
0.22%
jan 1, 1975
52.425
-0.118
-0.23%
jan 1, 1976
48.556
-3.869
-7.38%
jan 1, 1977
52.346
+3.791
7.81%
jan 1, 1978
52.077
-0.27
-0.52%
jan 1, 1979
53.289
+1.212
2.33%
jan 1, 1980
54.196
+0.908
1.7%
jan 1, 1981
54.071
-0.126
-0.23%
jan 1, 1982
54.632
+0.562
1.04%
jan 1, 1983
54.24
-0.392
-0.72%
jan 1, 1984
54.756
+0.516
0.95%
jan 1, 1985
53.989
-0.767
-1.4%
jan 1, 1986
53.338
-0.651
-1.21%
jan 1, 1987
53.843
+0.505
0.95%
jan 1, 1988
53.584
-0.259
-0.48%
jan 1, 1989
53.55
-0.035
-0.06%
jan 1, 1990
53.654
+0.105
0.2%
jan 1, 1991
54.058
+0.404
0.75%
jan 1, 1992
54.552
+0.494
0.91%
jan 1, 1993
53.483
-1.069
-1.96%
jan 1, 1994
53.802
+0.319
0.6%
jan 1, 1995
54.013
+0.211
0.39%
jan 1, 1996
53.899
-0.114
-0.21%
jan 1, 1997
53.542
-0.357
-0.66%
jan 1, 1998
53.663
+0.121
0.23%
jan 1, 1999
53.628
-0.035
-0.07%
jan 1, 2000
53.835
+0.207
0.39%
jan 1, 2001
53.43
-0.405
-0.75%
jan 1, 2002
53.149
-0.281
-0.53%
jan 1, 2003
52.96
-0.189
-0.36%
jan 1, 2004
56.209
+3.25
6.14%
jan 1, 2005
52.31
-3.9
-6.94%
jan 1, 2006
52.36
+0.051
0.1%
jan 1, 2007
53.009
+0.649
1.24%
jan 1, 2008
53.563
+0.554
1.05%
jan 1, 2009
53.569
+0.005
0.01%
jan 1, 2010
53.792
+0.224
0.42%
jan 1, 2011
53.738
-0.054
-0.1%
jan 1, 2012
53.556
-0.182
-0.34%
jan 1, 2013
53.498
-0.058
-0.11%
jan 1, 2014
53.157
-0.341
-0.64%
jan 1, 2015
53.231
+0.074
0.14%
Ranking of countries by current statistics by years


Comments: