29
/
en
AIzaSyAYiBZKx7MnpbEhh9jyipgxe19OcubqV5w
April 1, 2024
33761
European Union
EUU
false
2
1
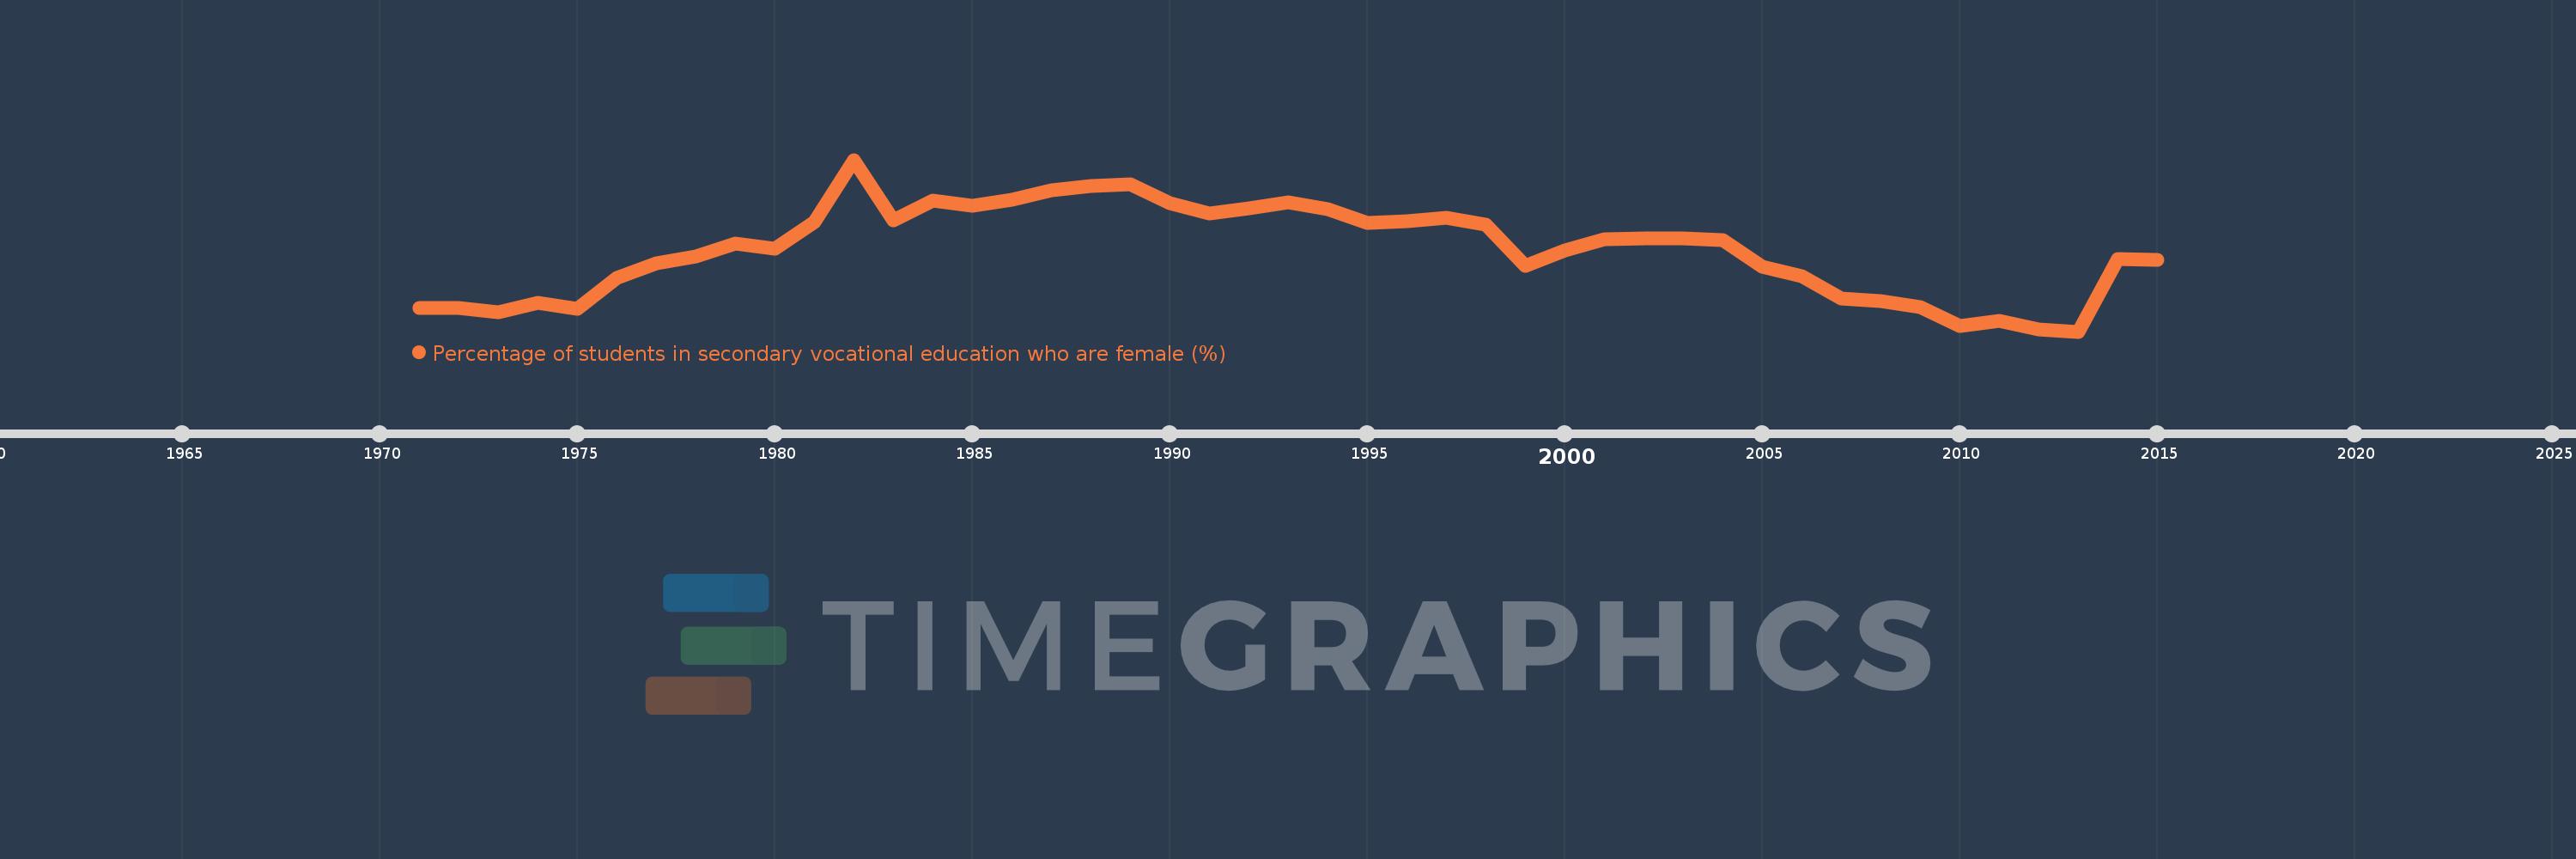
Percentage of students in secondary vocational education who are female (%)
2015,2014,2013,2012,2011,2010,2009,2008,2007,2006,2005,2004,2003,2002,2001,2000,1999,1998,1997,1996,1995,1994,1993,1992,1991,1990,1989,1988,1987,1986,1985,1984,1983,1982,1981,1980,1979,1978,1977,1976,1975,1974,1973,1972,1971
This statistics in other country:
AfghanistanAlbaniaAlgeriaAndorraAngolaAntigua and BarbudaArab WorldArgentinaArmeniaArubaAustraliaAustriaAzerbaijanBahrainBangladeshBarbadosBelarusBelgiumBelizeBeninBermudaBhutanBoliviaBosnia and HerzegovinaBotswanaBrazilBritish Virgin IslandsBrunei DarussalamBulgariaBurkina FasoBurundiCabo VerdeCambodiaCameroonCanadaCaribbean small statesCentral African RepublicCentral Europe and the BalticsChadChileChinaColombiaComorosCongo, Dem. Rep.Congo, Rep.Costa RicaCote d'IvoireCroatiaCubaCuracaoCyprusCzech RepublicDenmarkDjiboutiDominicaDominican RepublicEarly-demographic dividendEast Asia & PacificEast Asia & Pacific (excluding high income)East Asia & Pacific (IDA & IBRD countries)EcuadorEgypt, Arab Rep.El SalvadorEquatorial GuineaEritreaEstoniaEthiopiaEuro areaEurope & Central AsiaEurope & Central Asia (excluding high income)Europe & Central Asia (IDA & IBRD countries)European UnionFijiFinlandFragile and conflict affected situationsFranceGabonGambia, TheGeorgiaGermanyGhanaGibraltarGreeceGrenadaGuatemalaGuineaGuinea-BissauGuyanaHaitiHeavily indebted poor countries (HIPC)High incomeHondurasHong Kong SAR, ChinaHungaryIBRD onlyIcelandIDA & IBRD totalIDA blendIDA onlyIDA totalIndiaIndonesiaIran, Islamic Rep.IraqIrelandIsraelItalyJamaicaJapanJordanKazakhstanKenyaKiribatiKorea, Rep.KuwaitKyrgyz RepublicLao PDRLate-demographic dividendLatin America & Caribbean Latin America & Caribbean (excluding high income)Latin America & the Caribbean (IDA & IBRD countries)LatviaLeast developed countries: UN classificationLebanonLesothoLiberiaLibyaLiechtensteinLithuaniaLow & middle incomeLow incomeLower middle incomeLuxembourgMacao SAR, ChinaMacedonia, FYRMadagascarMalawiMalaysiaMaldivesMaliMaltaMarshall IslandsMauritaniaMauritiusMexicoMicronesia, Fed. Sts.Middle East & North AfricaMiddle East & North Africa (excluding high income)Middle East & North Africa (IDA & IBRD countries)Middle incomeMoldovaMonacoMongoliaMontenegroMoroccoMozambiqueMyanmarNamibiaNauruNepalNetherlandsNew ZealandNicaraguaNigerNigeriaNorth AmericaNorwayOECD membersOmanOther small statesPacific island small statesPakistanPanamaPapua New GuineaParaguayPeruPolandPortugalPost-demographic dividendPre-demographic dividendPuerto RicoQatarRomaniaRussian FederationRwandaSamoaSan MarinoSao Tome and PrincipeSaudi ArabiaSenegalSerbiaSeychellesSierra LeoneSingaporeSint Maarten (Dutch part)Slovak RepublicSloveniaSmall statesSolomon IslandsSomaliaSouth AfricaSouth AsiaSouth Asia (IDA & IBRD)SpainSri LankaSt. Kitts and NevisSt. LuciaSt. Vincent and the GrenadinesSub-Saharan Africa Sub-Saharan Africa (excluding high income)Sub-Saharan Africa (IDA & IBRD countries)SudanSurinameSwazilandSwedenSwitzerlandSyrian Arab RepublicTajikistanTanzaniaThailandTimor-LesteTogoTongaTrinidad and TobagoTunisiaTurkeyTurkmenistanTurks and Caicos IslandsTuvaluUgandaUkraineUnited Arab EmiratesUnited KingdomUpper middle incomeUruguayUzbekistanVanuatuVenezuela, RBVietnamWest Bank and GazaWorldYemen, Rep.ZambiaZimbabwe Timeline:
This timeline shows a graph from 1971 to 2015 of European Union. No data until 1970. Number of actual observations by date: 45.
Source name:
World Development Indicators
Source organization:
UNESCO Institute for Statistics
Categories, topics:
Education, Gender
Last updated:
apr 23, 2017
Indicators value changes by year
Minimum:
41.877
jan 1, 2013
At the date of observation
Value
Absolute change
Change from previous value
jan 1, 1971
42.601
+42.601
0.0%
jan 1, 1972
42.59
-0.011
-0.03%
jan 1, 1973
42.466
-0.124
-0.29%
jan 1, 1974
42.738
+0.273
0.64%
jan 1, 1975
42.561
-0.178
-0.42%
jan 1, 1976
43.497
+0.936
2.2%
jan 1, 1977
43.927
+0.43
0.99%
jan 1, 1978
44.147
+0.22
0.5%
jan 1, 1979
44.534
+0.387
0.88%
jan 1, 1980
44.367
-0.167
-0.37%
jan 1, 1981
45.166
+0.799
1.8%
jan 1, 1982
47.05
+1.884
4.17%
jan 1, 1983
45.22
-1.83
-3.89%
jan 1, 1984
45.834
+0.615
1.36%
jan 1, 1985
45.668
-0.167
-0.36%
jan 1, 1986
45.835
+0.167
0.37%
jan 1, 1987
46.125
+0.291
0.63%
jan 1, 1988
46.268
+0.142
0.31%
jan 1, 1989
46.314
+0.046
0.1%
jan 1, 1990
45.756
-0.558
-1.2%
jan 1, 1991
45.431
-0.325
-0.71%
jan 1, 1992
45.597
+0.166
0.37%
jan 1, 1993
45.775
+0.177
0.39%
jan 1, 1994
45.552
-0.223
-0.49%
jan 1, 1995
45.161
-0.391
-0.86%
jan 1, 1996
45.193
+0.032
0.07%
jan 1, 1997
45.296
+0.103
0.23%
jan 1, 1998
45.104
-0.192
-0.42%
jan 1, 1999
43.844
-1.26
-2.79%
jan 1, 2000
44.334
+0.49
1.12%
jan 1, 2001
44.654
+0.32
0.72%
jan 1, 2002
44.678
+0.024
0.05%
jan 1, 2003
44.694
+0.016
0.04%
jan 1, 2004
44.633
-0.061
-0.14%
jan 1, 2005
43.834
-0.799
-1.79%
jan 1, 2006
43.551
-0.283
-0.65%
jan 1, 2007
42.877
-0.674
-1.55%
jan 1, 2008
42.791
-0.086
-0.2%
jan 1, 2009
42.608
-0.183
-0.43%
jan 1, 2010
42.044
-0.564
-1.32%
jan 1, 2011
42.19
+0.145
0.35%
jan 1, 2012
41.946
-0.244
-0.58%
jan 1, 2013
41.877
-0.068
-0.16%
jan 1, 2014
44.069
+2.192
5.23%
jan 1, 2015
44.024
-0.045
-0.1%
Ranking of countries by current statistics by years


Comments: