29
/
en
AIzaSyAYiBZKx7MnpbEhh9jyipgxe19OcubqV5w
April 1, 2024
228948
Romania
ROU
true
2
1
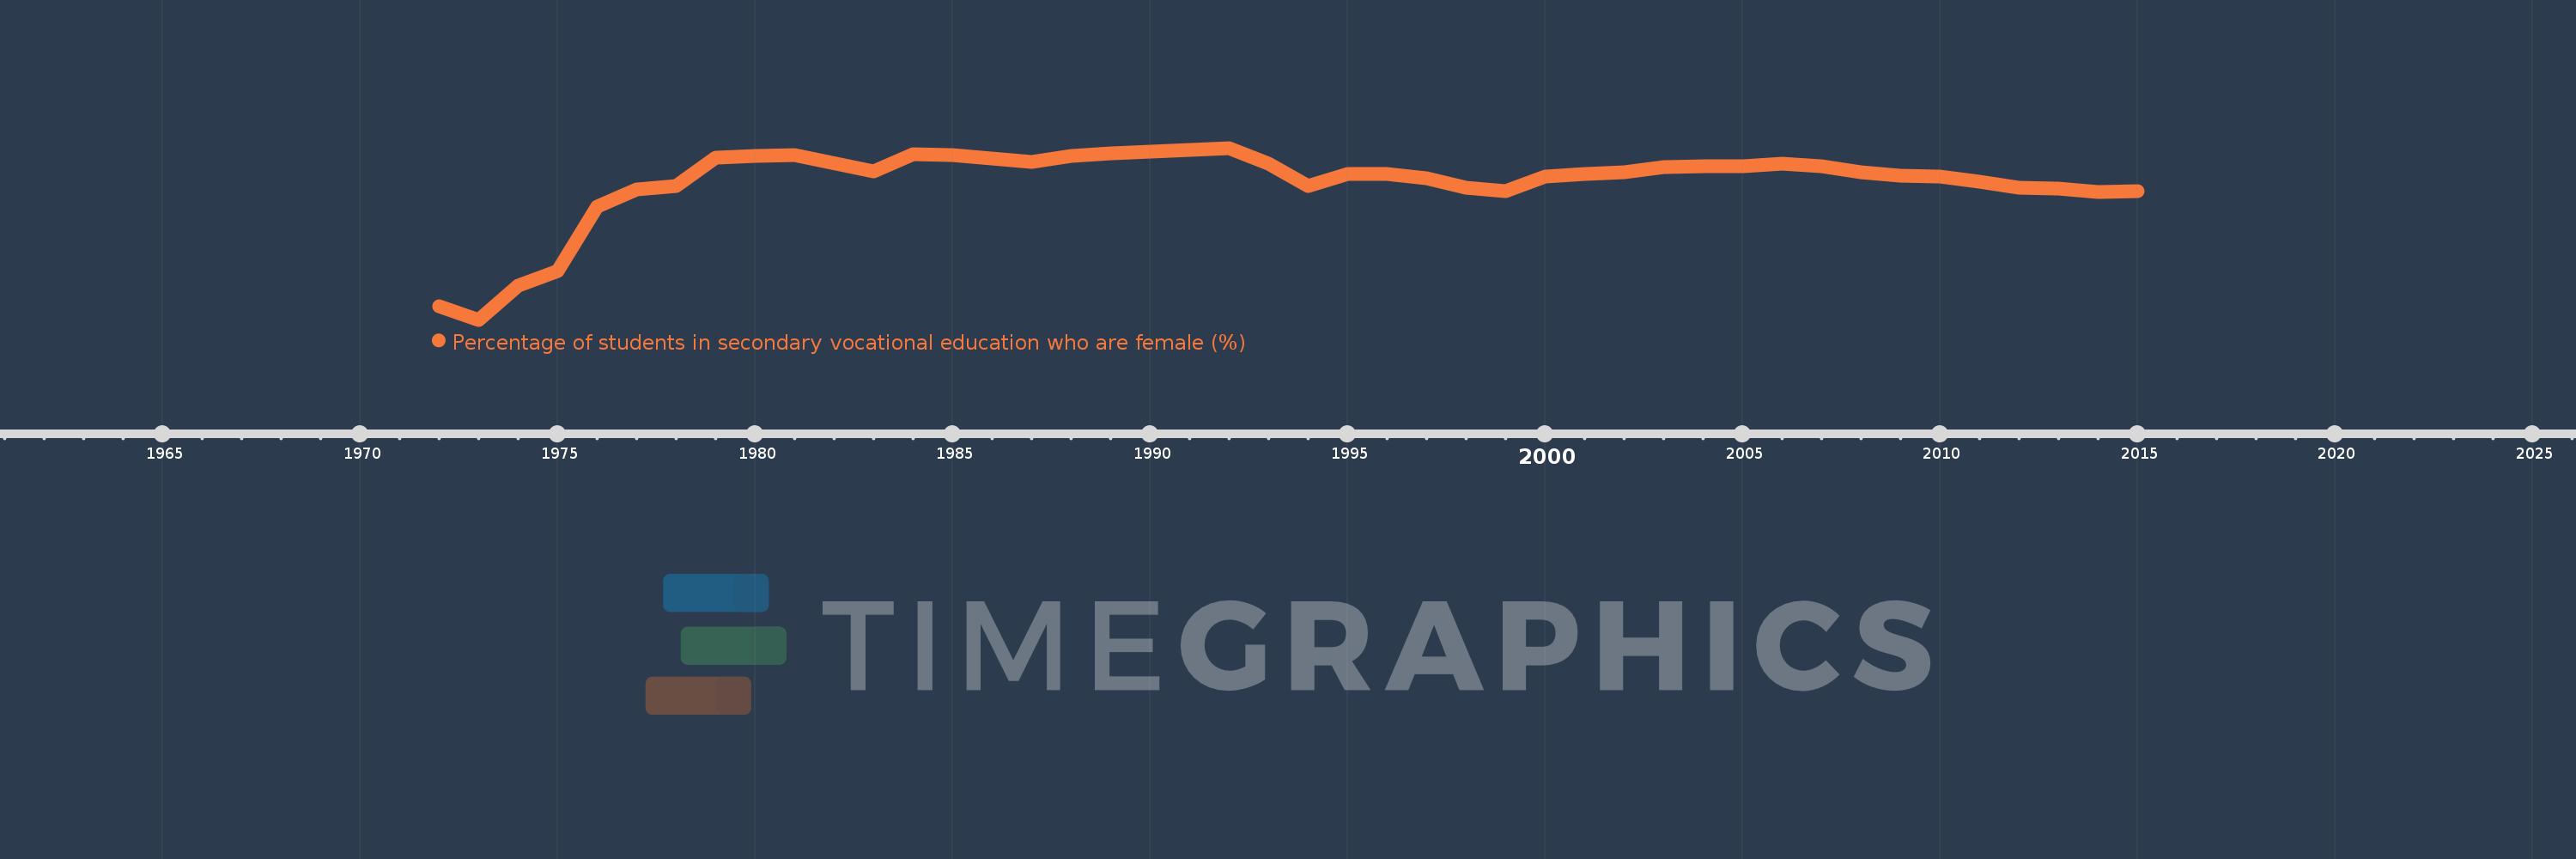
Percentage of students in secondary vocational education who are female (%)
2015,2014,2013,2012,2011,2010,2009,2008,2007,2006,2005,2004,2003,2002,2001,2000,1999,1998,1997,1996,1995,1994,1993,1992,1989,1988,1987,1986,1985,1984,1983,1981,1980,1979,1978,1977,1976,1975,1974,1973,1972
This statistics in other country:
AfghanistanAlbaniaAlgeriaAndorraAngolaAntigua and BarbudaArab WorldArgentinaArmeniaArubaAustraliaAustriaAzerbaijanBahrainBangladeshBarbadosBelarusBelgiumBelizeBeninBermudaBhutanBoliviaBosnia and HerzegovinaBotswanaBrazilBritish Virgin IslandsBrunei DarussalamBulgariaBurkina FasoBurundiCabo VerdeCambodiaCameroonCanadaCaribbean small statesCentral African RepublicCentral Europe and the BalticsChadChileChinaColombiaComorosCongo, Dem. Rep.Congo, Rep.Costa RicaCote d'IvoireCroatiaCubaCuracaoCyprusCzech RepublicDenmarkDjiboutiDominicaDominican RepublicEarly-demographic dividendEast Asia & PacificEast Asia & Pacific (excluding high income)East Asia & Pacific (IDA & IBRD countries)EcuadorEgypt, Arab Rep.El SalvadorEquatorial GuineaEritreaEstoniaEthiopiaEuro areaEurope & Central AsiaEurope & Central Asia (excluding high income)Europe & Central Asia (IDA & IBRD countries)European UnionFijiFinlandFragile and conflict affected situationsFranceGabonGambia, TheGeorgiaGermanyGhanaGibraltarGreeceGrenadaGuatemalaGuineaGuinea-BissauGuyanaHaitiHeavily indebted poor countries (HIPC)High incomeHondurasHong Kong SAR, ChinaHungaryIBRD onlyIcelandIDA & IBRD totalIDA blendIDA onlyIDA totalIndiaIndonesiaIran, Islamic Rep.IraqIrelandIsraelItalyJamaicaJapanJordanKazakhstanKenyaKiribatiKorea, Rep.KuwaitKyrgyz RepublicLao PDRLate-demographic dividendLatin America & Caribbean Latin America & Caribbean (excluding high income)Latin America & the Caribbean (IDA & IBRD countries)LatviaLeast developed countries: UN classificationLebanonLesothoLiberiaLibyaLiechtensteinLithuaniaLow & middle incomeLow incomeLower middle incomeLuxembourgMacao SAR, ChinaMacedonia, FYRMadagascarMalawiMalaysiaMaldivesMaliMaltaMarshall IslandsMauritaniaMauritiusMexicoMicronesia, Fed. Sts.Middle East & North AfricaMiddle East & North Africa (excluding high income)Middle East & North Africa (IDA & IBRD countries)Middle incomeMoldovaMonacoMongoliaMontenegroMoroccoMozambiqueMyanmarNamibiaNauruNepalNetherlandsNew ZealandNicaraguaNigerNigeriaNorth AmericaNorwayOECD membersOmanOther small statesPacific island small statesPakistanPanamaPapua New GuineaParaguayPeruPolandPortugalPost-demographic dividendPre-demographic dividendPuerto RicoQatarRomaniaRussian FederationRwandaSamoaSan MarinoSao Tome and PrincipeSaudi ArabiaSenegalSerbiaSeychellesSierra LeoneSingaporeSint Maarten (Dutch part)Slovak RepublicSloveniaSmall statesSolomon IslandsSomaliaSouth AfricaSouth AsiaSouth Asia (IDA & IBRD)SpainSri LankaSt. Kitts and NevisSt. LuciaSt. Vincent and the GrenadinesSub-Saharan Africa Sub-Saharan Africa (excluding high income)Sub-Saharan Africa (IDA & IBRD countries)SudanSurinameSwazilandSwedenSwitzerlandSyrian Arab RepublicTajikistanTanzaniaThailandTimor-LesteTogoTongaTrinidad and TobagoTunisiaTurkeyTurkmenistanTurks and Caicos IslandsTuvaluUgandaUkraineUnited Arab EmiratesUnited KingdomUpper middle incomeUruguayUzbekistanVanuatuVenezuela, RBVietnamWest Bank and GazaWorldYemen, Rep.ZambiaZimbabwe Timeline:
This timeline shows a graph from 1972 to 2015 of Romania. No data until 1971. Number of actual observations by date: 41.
Source name:
World Development Indicators
Source organization:
UNESCO Institute for Statistics
Categories, topics:
Education, Gender
Last updated:
apr 23, 2017
Indicators value changes by year
At the date of observation
Value
Absolute change
Change from previous value
jan 1, 1972
30.011
+30.011
0.0%
jan 1, 1973
28.69
-1.321
-4.4%
jan 1, 1974
32.079
+3.389
11.81%
jan 1, 1975
33.614
+1.535
4.79%
jan 1, 1976
40.036
+6.422
19.1%
jan 1, 1977
41.784
+1.748
4.37%
jan 1, 1978
42.133
+0.349
0.84%
jan 1, 1979
44.923
+2.79
6.62%
jan 1, 1980
45.088
+0.166
0.37%
jan 1, 1981
45.231
+0.142
0.32%
jan 1, 1983
43.612
-1.619
-3.58%
jan 1, 1984
45.287
+1.675
3.84%
jan 1, 1985
45.242
-0.045
-0.1%
jan 1, 1986
44.851
-0.391
-0.86%
jan 1, 1987
44.552
-0.299
-0.67%
jan 1, 1988
45.099
+0.547
1.23%
jan 1, 1989
45.38
+0.281
0.62%
jan 1, 1992
45.93
+0.55
1.21%
jan 1, 1993
44.381
-1.549
-3.37%
jan 1, 1994
42.149
-2.232
-5.03%
jan 1, 1995
43.3
+1.151
2.73%
jan 1, 1996
43.306
+0.005
0.01%
jan 1, 1997
42.852
-0.454
-1.05%
jan 1, 1998
41.945
-0.907
-2.12%
jan 1, 1999
41.567
-0.378
-0.9%
jan 1, 2000
43.033
+1.466
3.53%
jan 1, 2001
43.329
+0.296
0.69%
jan 1, 2002
43.473
+0.144
0.33%
jan 1, 2003
43.969
+0.496
1.14%
jan 1, 2004
44.079
+0.11
0.25%
jan 1, 2005
44.106
+0.027
0.06%
jan 1, 2006
44.327
+0.221
0.5%
jan 1, 2007
44.058
-0.269
-0.61%
jan 1, 2008
43.455
-0.603
-1.37%
jan 1, 2009
43.129
-0.325
-0.75%
jan 1, 2010
43.074
-0.056
-0.13%
jan 1, 2011
42.552
-0.522
-1.21%
jan 1, 2012
41.945
-0.607
-1.43%
jan 1, 2013
41.894
-0.051
-0.12%
jan 1, 2014
41.539
-0.355
-0.85%
jan 1, 2015
41.563
+0.024
0.06%
Ranking of countries by current statistics by years


Comments: