30
/
AIzaSyAYiBZKx7MnpbEhh9jyipgxe19OcubqV5w
April 1, 2024
148371
Guyana
GUY
true
2
1
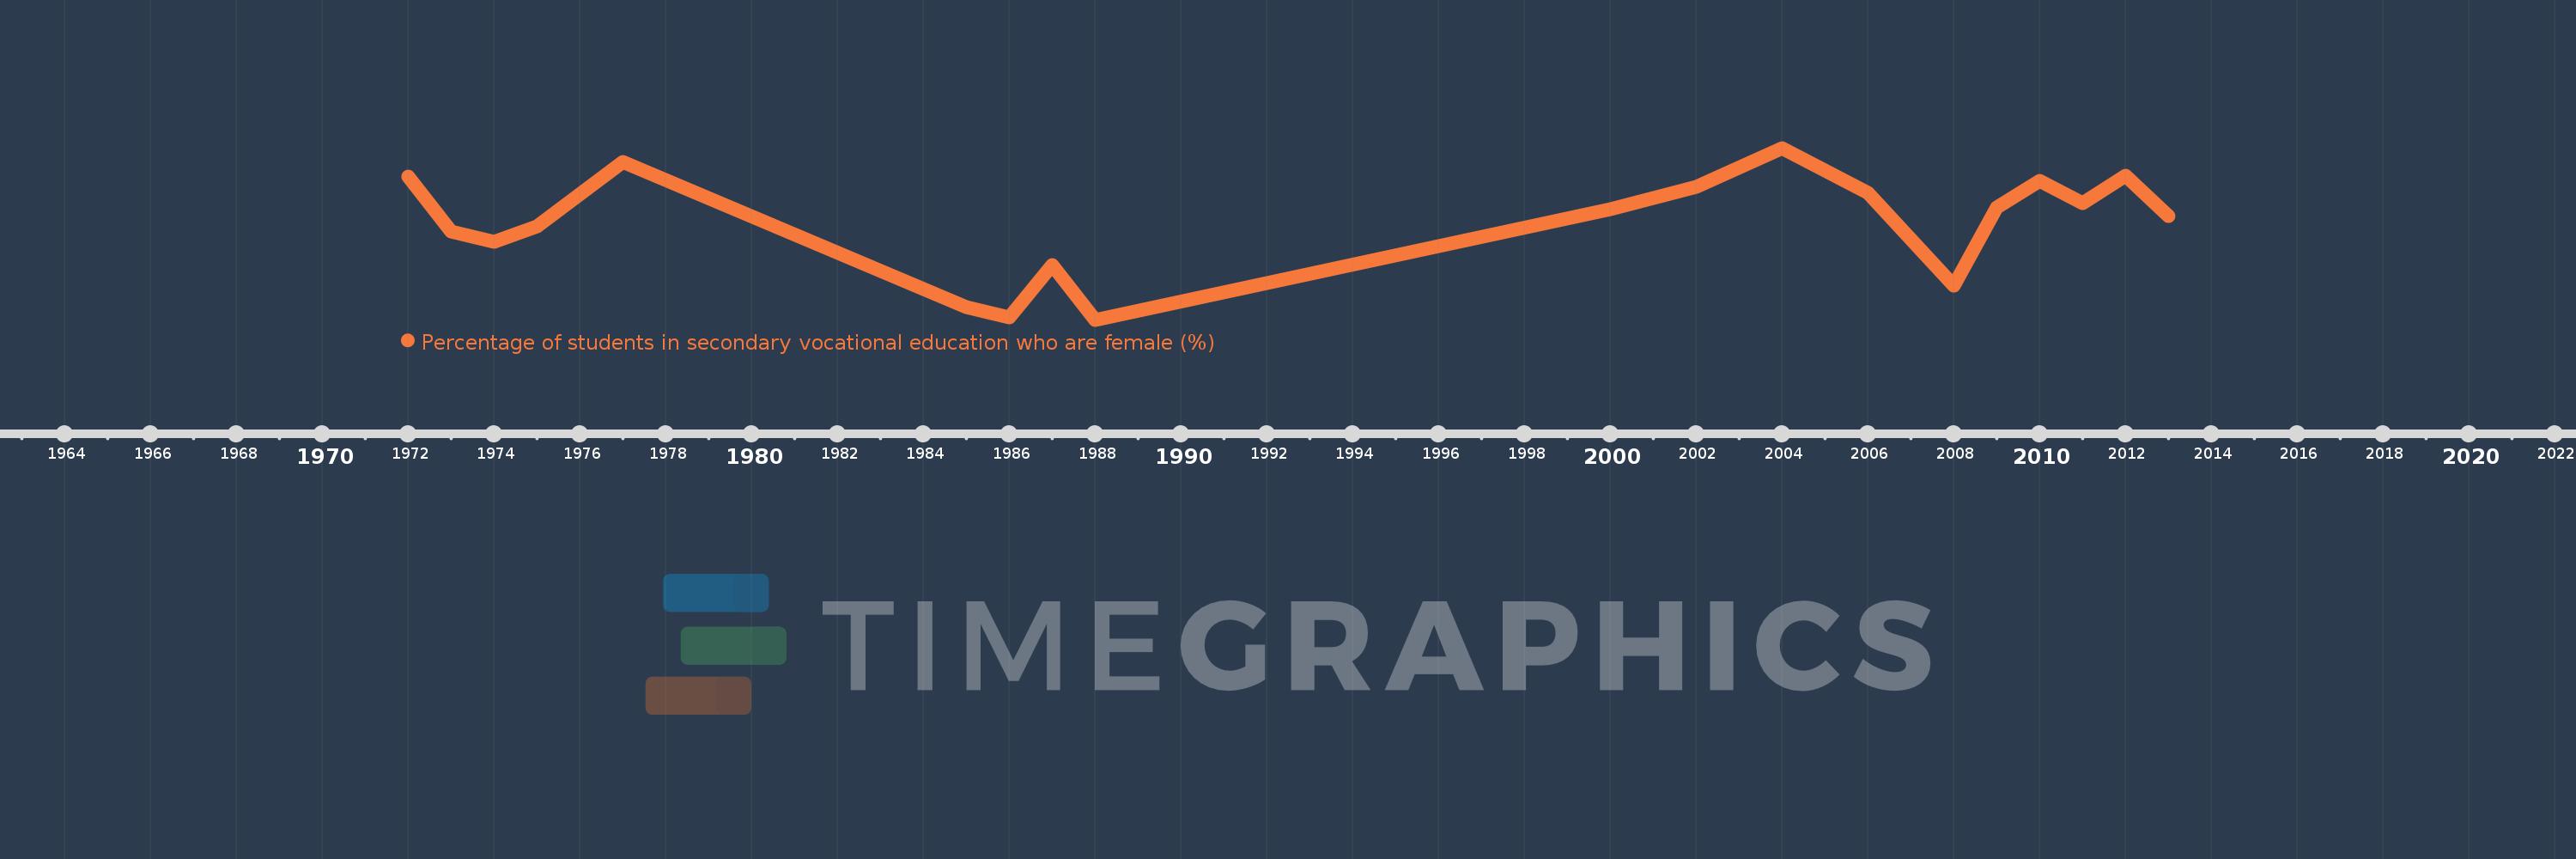
Percentage of students in secondary vocational education who are female (%)
2013,2012,2011,2010,2009,2008,2006,2004,2002,2000,1988,1987,1986,1985,1977,1975,1974,1973,1972
