29
/
en
AIzaSyAYiBZKx7MnpbEhh9jyipgxe19OcubqV5w
April 1, 2024
62928
World
WLD
false
2
1
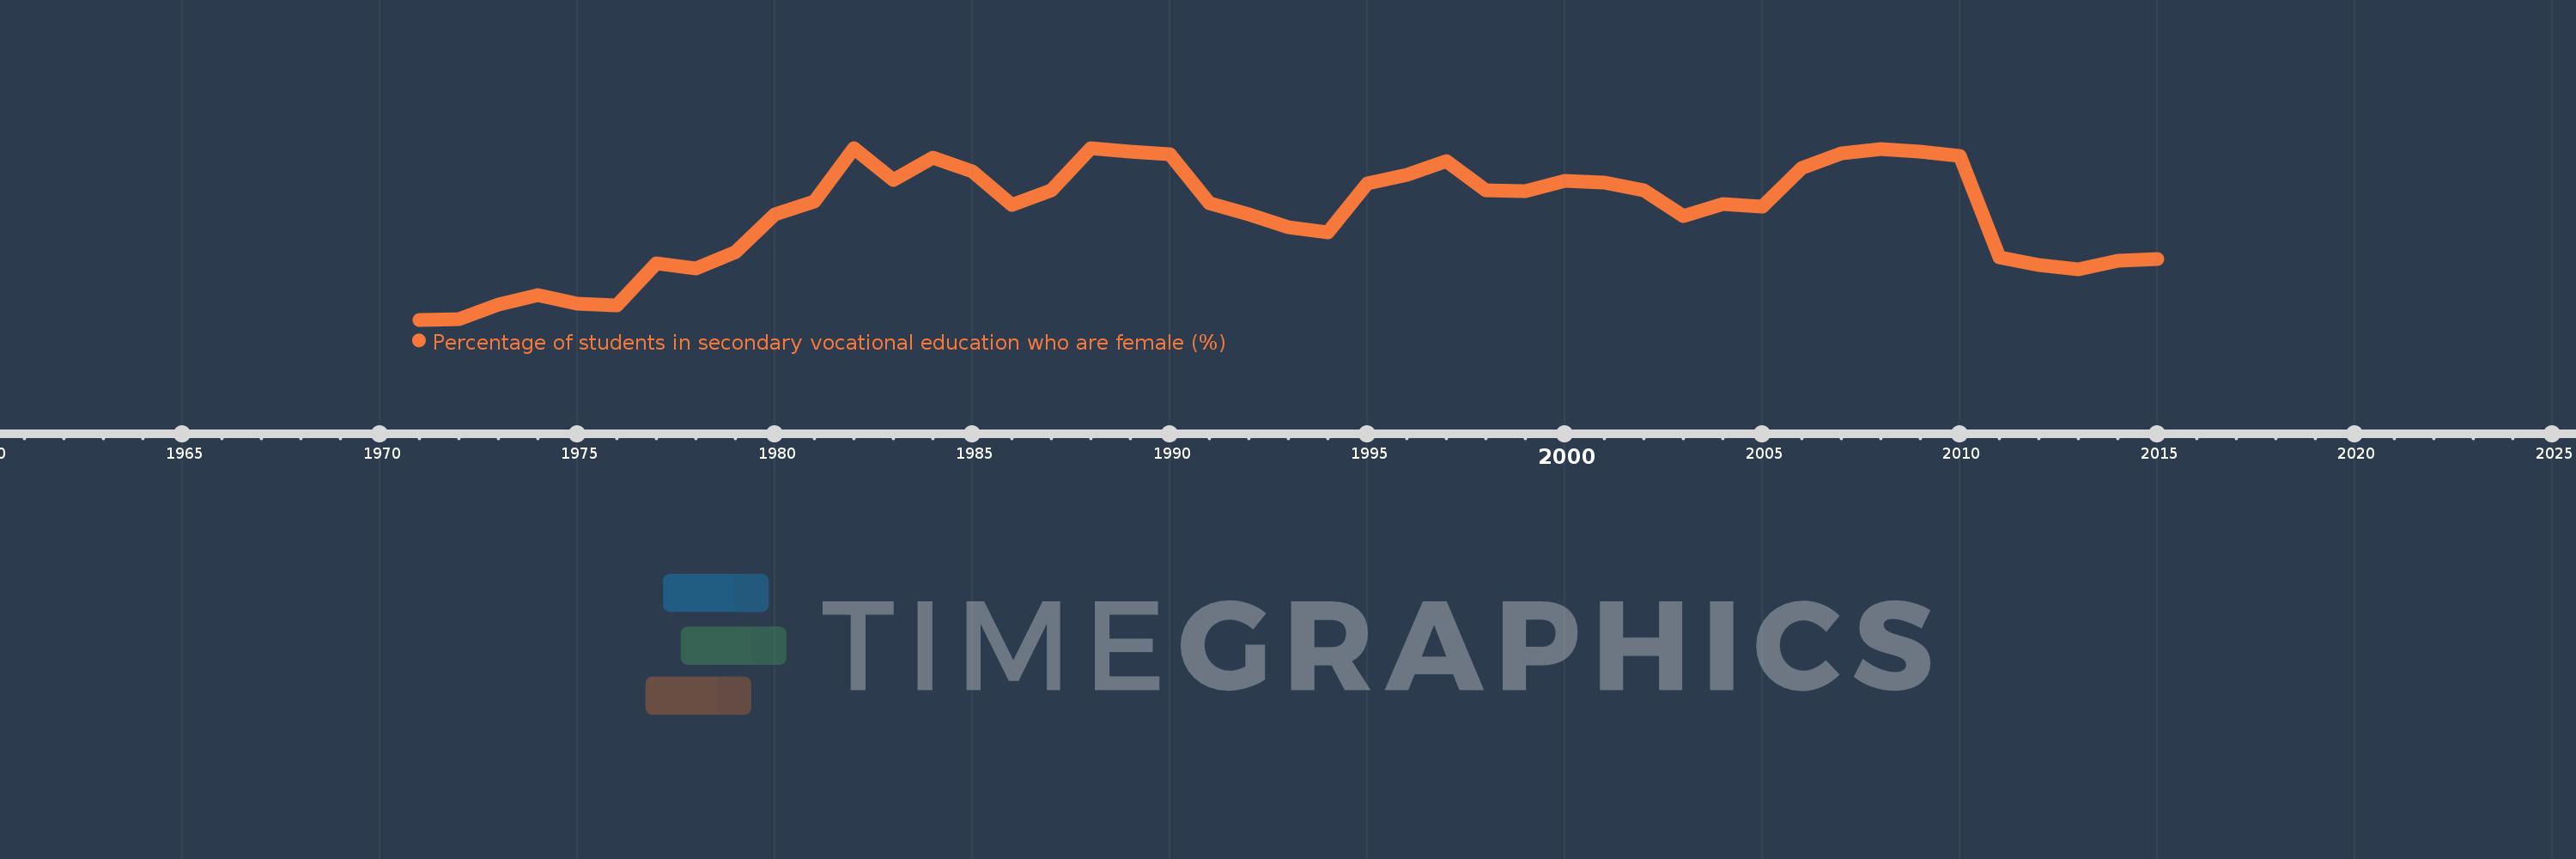
Percentage of students in secondary vocational education who are female (%)
2015,2014,2013,2012,2011,2010,2009,2008,2007,2006,2005,2004,2003,2002,2001,2000,1999,1998,1997,1996,1995,1994,1993,1992,1991,1990,1989,1988,1987,1986,1985,1984,1983,1982,1981,1980,1979,1978,1977,1976,1975,1974,1973,1972,1971
This statistics in other country:
AfghanistanAlbaniaAlgeriaAndorraAngolaAntigua and BarbudaArab WorldArgentinaArmeniaArubaAustraliaAustriaAzerbaijanBahrainBangladeshBarbadosBelarusBelgiumBelizeBeninBermudaBhutanBoliviaBosnia and HerzegovinaBotswanaBrazilBritish Virgin IslandsBrunei DarussalamBulgariaBurkina FasoBurundiCabo VerdeCambodiaCameroonCanadaCaribbean small statesCentral African RepublicCentral Europe and the BalticsChadChileChinaColombiaComorosCongo, Dem. Rep.Congo, Rep.Costa RicaCote d'IvoireCroatiaCubaCuracaoCyprusCzech RepublicDenmarkDjiboutiDominicaDominican RepublicEarly-demographic dividendEast Asia & PacificEast Asia & Pacific (excluding high income)East Asia & Pacific (IDA & IBRD countries)EcuadorEgypt, Arab Rep.El SalvadorEquatorial GuineaEritreaEstoniaEthiopiaEuro areaEurope & Central AsiaEurope & Central Asia (excluding high income)Europe & Central Asia (IDA & IBRD countries)European UnionFijiFinlandFragile and conflict affected situationsFranceGabonGambia, TheGeorgiaGermanyGhanaGibraltarGreeceGrenadaGuatemalaGuineaGuinea-BissauGuyanaHaitiHeavily indebted poor countries (HIPC)High incomeHondurasHong Kong SAR, ChinaHungaryIBRD onlyIcelandIDA & IBRD totalIDA blendIDA onlyIDA totalIndiaIndonesiaIran, Islamic Rep.IraqIrelandIsraelItalyJamaicaJapanJordanKazakhstanKenyaKiribatiKorea, Rep.KuwaitKyrgyz RepublicLao PDRLate-demographic dividendLatin America & Caribbean Latin America & Caribbean (excluding high income)Latin America & the Caribbean (IDA & IBRD countries)LatviaLeast developed countries: UN classificationLebanonLesothoLiberiaLibyaLiechtensteinLithuaniaLow & middle incomeLow incomeLower middle incomeLuxembourgMacao SAR, ChinaMacedonia, FYRMadagascarMalawiMalaysiaMaldivesMaliMaltaMarshall IslandsMauritaniaMauritiusMexicoMicronesia, Fed. Sts.Middle East & North AfricaMiddle East & North Africa (excluding high income)Middle East & North Africa (IDA & IBRD countries)Middle incomeMoldovaMonacoMongoliaMontenegroMoroccoMozambiqueMyanmarNamibiaNauruNepalNetherlandsNew ZealandNicaraguaNigerNigeriaNorth AmericaNorwayOECD membersOmanOther small statesPacific island small statesPakistanPanamaPapua New GuineaParaguayPeruPolandPortugalPost-demographic dividendPre-demographic dividendPuerto RicoQatarRomaniaRussian FederationRwandaSamoaSan MarinoSao Tome and PrincipeSaudi ArabiaSenegalSerbiaSeychellesSierra LeoneSingaporeSint Maarten (Dutch part)Slovak RepublicSloveniaSmall statesSolomon IslandsSomaliaSouth AfricaSouth AsiaSouth Asia (IDA & IBRD)SpainSri LankaSt. Kitts and NevisSt. LuciaSt. Vincent and the GrenadinesSub-Saharan Africa Sub-Saharan Africa (excluding high income)Sub-Saharan Africa (IDA & IBRD countries)SudanSurinameSwazilandSwedenSwitzerlandSyrian Arab RepublicTajikistanTanzaniaThailandTimor-LesteTogoTongaTrinidad and TobagoTunisiaTurkeyTurkmenistanTurks and Caicos IslandsTuvaluUgandaUkraineUnited Arab EmiratesUnited KingdomUpper middle incomeUruguayUzbekistanVanuatuVenezuela, RBVietnamWest Bank and GazaWorldYemen, Rep.ZambiaZimbabwe Timeline:
This timeline shows a graph from 1971 to 2015 of World. No data until 1970. Number of actual observations by date: 45.
Source name:
World Development Indicators
Source organization:
UNESCO Institute for Statistics
Categories, topics:
Education, Gender
Last updated:
apr 23, 2017
Indicators value changes by year
Minimum:
42.359
jan 1, 1971
Maximum:
45.365
jan 1, 1982
At the date of observation
Value
Absolute change
Change from previous value
jan 1, 1971
42.359
+42.359
0.0%
jan 1, 1972
42.364
+0.004
0.01%
jan 1, 1973
42.627
+0.263
0.62%
jan 1, 1974
42.79
+0.163
0.38%
jan 1, 1975
42.636
-0.154
-0.36%
jan 1, 1976
42.604
-0.033
-0.08%
jan 1, 1977
43.34
+0.737
1.73%
jan 1, 1978
43.263
-0.077
-0.18%
jan 1, 1979
43.549
+0.287
0.66%
jan 1, 1980
44.201
+0.652
1.5%
jan 1, 1981
44.426
+0.224
0.51%
jan 1, 1982
45.365
+0.939
2.11%
jan 1, 1983
44.809
-0.557
-1.23%
jan 1, 1984
45.189
+0.38
0.85%
jan 1, 1985
44.955
-0.233
-0.52%
jan 1, 1986
44.363
-0.592
-1.32%
jan 1, 1987
44.618
+0.255
0.57%
jan 1, 1988
45.354
+0.736
1.65%
jan 1, 1989
45.293
-0.062
-0.14%
jan 1, 1990
45.254
-0.039
-0.09%
jan 1, 1991
44.392
-0.862
-1.9%
jan 1, 1992
44.209
-0.183
-0.41%
jan 1, 1993
43.982
-0.227
-0.51%
jan 1, 1994
43.889
-0.093
-0.21%
jan 1, 1995
44.737
+0.848
1.93%
jan 1, 1996
44.889
+0.152
0.34%
jan 1, 1997
45.142
+0.253
0.56%
jan 1, 1998
44.619
-0.523
-1.16%
jan 1, 1999
44.616
-0.003
-0.01%
jan 1, 2000
44.794
+0.178
0.4%
jan 1, 2001
44.752
-0.042
-0.09%
jan 1, 2002
44.619
-0.133
-0.3%
jan 1, 2003
44.173
-0.446
-1.0%
jan 1, 2004
44.382
+0.209
0.47%
jan 1, 2005
44.342
-0.04
-0.09%
jan 1, 2006
45.015
+0.673
1.52%
jan 1, 2007
45.264
+0.249
0.55%
jan 1, 2008
45.344
+0.08
0.18%
jan 1, 2009
45.305
-0.039
-0.09%
jan 1, 2010
45.229
-0.076
-0.17%
jan 1, 2011
43.445
-1.784
-3.94%
jan 1, 2012
43.318
-0.127
-0.29%
jan 1, 2013
43.246
-0.073
-0.17%
jan 1, 2014
43.388
+0.143
0.33%
jan 1, 2015
43.415
+0.027
0.06%
Ranking of countries by current statistics by years


Comments: