29
/
en
AIzaSyAYiBZKx7MnpbEhh9jyipgxe19OcubqV5w
April 1, 2024
231510
Rwanda
RWA
true
2
1
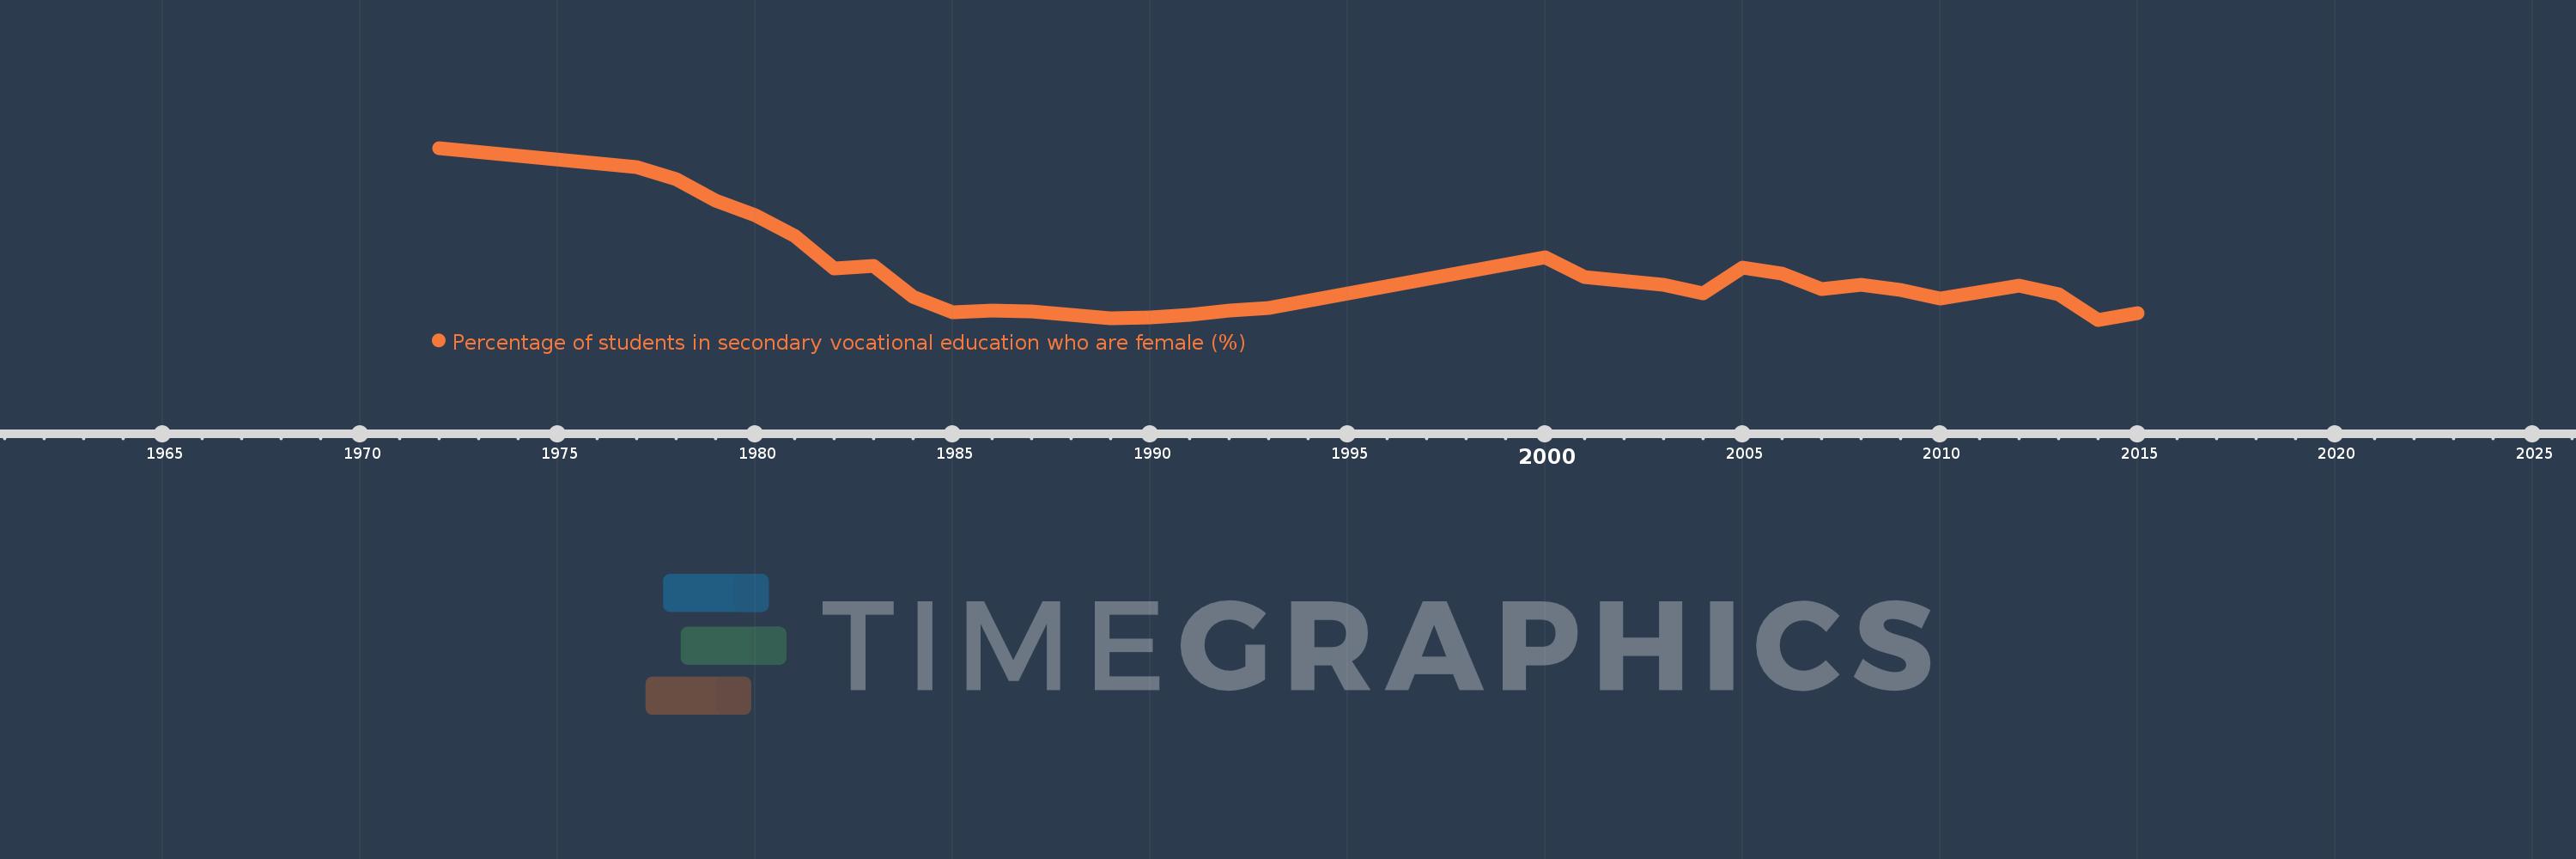
Percentage of students in secondary vocational education who are female (%)
2015,2014,2013,2012,2010,2009,2008,2007,2006,2005,2004,2003,2001,2000,1993,1992,1991,1990,1989,1988,1987,1986,1985,1984,1983,1982,1981,1980,1979,1978,1977,1972
This statistics in other country:
AfghanistanAlbaniaAlgeriaAndorraAngolaAntigua and BarbudaArab WorldArgentinaArmeniaArubaAustraliaAustriaAzerbaijanBahrainBangladeshBarbadosBelarusBelgiumBelizeBeninBermudaBhutanBoliviaBosnia and HerzegovinaBotswanaBrazilBritish Virgin IslandsBrunei DarussalamBulgariaBurkina FasoBurundiCabo VerdeCambodiaCameroonCanadaCaribbean small statesCentral African RepublicCentral Europe and the BalticsChadChileChinaColombiaComorosCongo, Dem. Rep.Congo, Rep.Costa RicaCote d'IvoireCroatiaCubaCuracaoCyprusCzech RepublicDenmarkDjiboutiDominicaDominican RepublicEarly-demographic dividendEast Asia & PacificEast Asia & Pacific (excluding high income)East Asia & Pacific (IDA & IBRD countries)EcuadorEgypt, Arab Rep.El SalvadorEquatorial GuineaEritreaEstoniaEthiopiaEuro areaEurope & Central AsiaEurope & Central Asia (excluding high income)Europe & Central Asia (IDA & IBRD countries)European UnionFijiFinlandFragile and conflict affected situationsFranceGabonGambia, TheGeorgiaGermanyGhanaGibraltarGreeceGrenadaGuatemalaGuineaGuinea-BissauGuyanaHaitiHeavily indebted poor countries (HIPC)High incomeHondurasHong Kong SAR, ChinaHungaryIBRD onlyIcelandIDA & IBRD totalIDA blendIDA onlyIDA totalIndiaIndonesiaIran, Islamic Rep.IraqIrelandIsraelItalyJamaicaJapanJordanKazakhstanKenyaKiribatiKorea, Rep.KuwaitKyrgyz RepublicLao PDRLate-demographic dividendLatin America & Caribbean Latin America & Caribbean (excluding high income)Latin America & the Caribbean (IDA & IBRD countries)LatviaLeast developed countries: UN classificationLebanonLesothoLiberiaLibyaLiechtensteinLithuaniaLow & middle incomeLow incomeLower middle incomeLuxembourgMacao SAR, ChinaMacedonia, FYRMadagascarMalawiMalaysiaMaldivesMaliMaltaMarshall IslandsMauritaniaMauritiusMexicoMicronesia, Fed. Sts.Middle East & North AfricaMiddle East & North Africa (excluding high income)Middle East & North Africa (IDA & IBRD countries)Middle incomeMoldovaMonacoMongoliaMontenegroMoroccoMozambiqueMyanmarNamibiaNauruNepalNetherlandsNew ZealandNicaraguaNigerNigeriaNorth AmericaNorwayOECD membersOmanOther small statesPacific island small statesPakistanPanamaPapua New GuineaParaguayPeruPolandPortugalPost-demographic dividendPre-demographic dividendPuerto RicoQatarRomaniaRussian FederationRwandaSamoaSan MarinoSao Tome and PrincipeSaudi ArabiaSenegalSerbiaSeychellesSierra LeoneSingaporeSint Maarten (Dutch part)Slovak RepublicSloveniaSmall statesSolomon IslandsSomaliaSouth AfricaSouth AsiaSouth Asia (IDA & IBRD)SpainSri LankaSt. Kitts and NevisSt. LuciaSt. Vincent and the GrenadinesSub-Saharan Africa Sub-Saharan Africa (excluding high income)Sub-Saharan Africa (IDA & IBRD countries)SudanSurinameSwazilandSwedenSwitzerlandSyrian Arab RepublicTajikistanTanzaniaThailandTimor-LesteTogoTongaTrinidad and TobagoTunisiaTurkeyTurkmenistanTurks and Caicos IslandsTuvaluUgandaUkraineUnited Arab EmiratesUnited KingdomUpper middle incomeUruguayUzbekistanVanuatuVenezuela, RBVietnamWest Bank and GazaWorldYemen, Rep.ZambiaZimbabwe Timeline:
This timeline shows a graph from 1972 to 2015 of Rwanda. No data until 1971. Number of actual observations by date: 32.
Source name:
World Development Indicators
Source organization:
UNESCO Institute for Statistics
Categories, topics:
Education, Gender
Last updated:
apr 23, 2017
Indicators value changes by year
Minimum:
44.111
jan 1, 2014
Maximum:
72.175
jan 1, 1972
At the date of observation
Value
Absolute change
Change from previous value
jan 1, 1972
72.175
+72.175
0.0%
jan 1, 1977
69.026
-3.149
-4.36%
jan 1, 1978
67.104
-1.922
-2.78%
jan 1, 1979
63.534
-3.57
-5.32%
jan 1, 1980
61.214
-2.321
-3.65%
jan 1, 1981
57.801
-3.413
-5.58%
jan 1, 1982
52.486
-5.315
-9.2%
jan 1, 1983
52.926
+0.44
0.84%
jan 1, 1984
47.925
-5.001
-9.45%
jan 1, 1985
45.328
-2.597
-5.42%
jan 1, 1986
45.598
+0.27
0.6%
jan 1, 1987
45.413
-0.185
-0.41%
jan 1, 1988
44.852
-0.562
-1.24%
jan 1, 1989
44.408
-0.444
-0.99%
jan 1, 1990
44.468
+0.06
0.14%
jan 1, 1991
44.874
+0.406
0.91%
jan 1, 1992
45.621
+0.747
1.67%
jan 1, 1993
46.082
+0.46
1.01%
jan 1, 2000
54.344
+8.262
17.93%
jan 1, 2001
51.033
-3.311
-6.09%
jan 1, 2003
49.813
-1.22
-2.39%
jan 1, 2004
48.355
-1.459
-2.93%
jan 1, 2005
52.61
+4.255
8.8%
jan 1, 2006
51.692
-0.919
-1.75%
jan 1, 2007
49.097
-2.595
-5.02%
jan 1, 2008
49.877
+0.78
1.59%
jan 1, 2009
49.007
-0.869
-1.74%
jan 1, 2010
47.64
-1.367
-2.79%
jan 1, 2012
49.648
+2.008
4.21%
jan 1, 2013
48.267
-1.38
-2.78%
jan 1, 2014
44.111
-4.156
-8.61%
jan 1, 2015
45.15
+1.038
2.35%
Ranking of countries by current statistics by years


Comments: