29
/
en
AIzaSyAYiBZKx7MnpbEhh9jyipgxe19OcubqV5w
April 1, 2024
27603
East Asia & Pacific
EAS
false
2
1
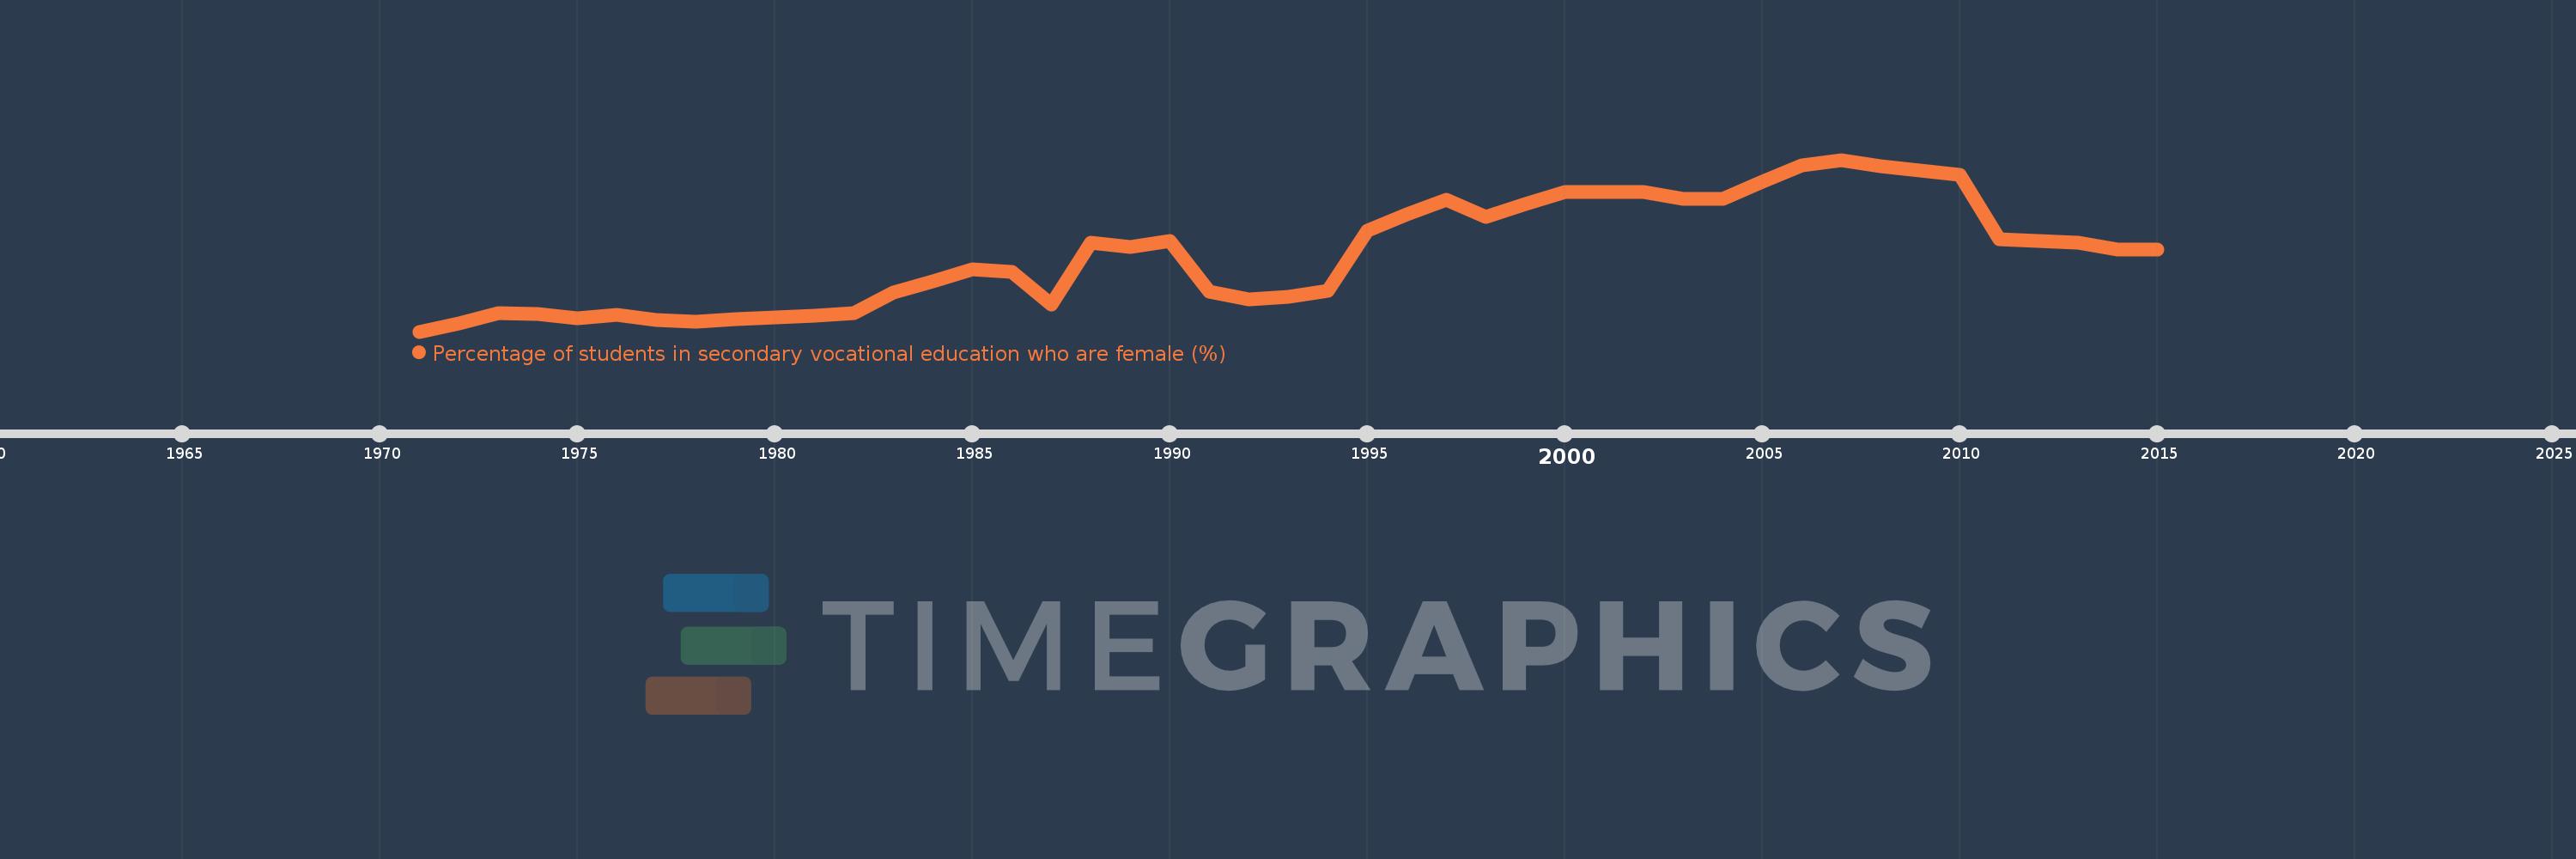
Percentage of students in secondary vocational education who are female (%)
2015,2014,2013,2012,2011,2010,2009,2008,2007,2006,2005,2004,2003,2002,2001,2000,1999,1998,1997,1996,1995,1994,1993,1992,1991,1990,1989,1988,1987,1986,1985,1984,1983,1982,1981,1980,1979,1978,1977,1976,1975,1974,1973,1972,1971
This statistics in other country:
AfghanistanAlbaniaAlgeriaAndorraAngolaAntigua and BarbudaArab WorldArgentinaArmeniaArubaAustraliaAustriaAzerbaijanBahrainBangladeshBarbadosBelarusBelgiumBelizeBeninBermudaBhutanBoliviaBosnia and HerzegovinaBotswanaBrazilBritish Virgin IslandsBrunei DarussalamBulgariaBurkina FasoBurundiCabo VerdeCambodiaCameroonCanadaCaribbean small statesCentral African RepublicCentral Europe and the BalticsChadChileChinaColombiaComorosCongo, Dem. Rep.Congo, Rep.Costa RicaCote d'IvoireCroatiaCubaCuracaoCyprusCzech RepublicDenmarkDjiboutiDominicaDominican RepublicEarly-demographic dividendEast Asia & PacificEast Asia & Pacific (excluding high income)East Asia & Pacific (IDA & IBRD countries)EcuadorEgypt, Arab Rep.El SalvadorEquatorial GuineaEritreaEstoniaEthiopiaEuro areaEurope & Central AsiaEurope & Central Asia (excluding high income)Europe & Central Asia (IDA & IBRD countries)European UnionFijiFinlandFragile and conflict affected situationsFranceGabonGambia, TheGeorgiaGermanyGhanaGibraltarGreeceGrenadaGuatemalaGuineaGuinea-BissauGuyanaHaitiHeavily indebted poor countries (HIPC)High incomeHondurasHong Kong SAR, ChinaHungaryIBRD onlyIcelandIDA & IBRD totalIDA blendIDA onlyIDA totalIndiaIndonesiaIran, Islamic Rep.IraqIrelandIsraelItalyJamaicaJapanJordanKazakhstanKenyaKiribatiKorea, Rep.KuwaitKyrgyz RepublicLao PDRLate-demographic dividendLatin America & Caribbean Latin America & Caribbean (excluding high income)Latin America & the Caribbean (IDA & IBRD countries)LatviaLeast developed countries: UN classificationLebanonLesothoLiberiaLibyaLiechtensteinLithuaniaLow & middle incomeLow incomeLower middle incomeLuxembourgMacao SAR, ChinaMacedonia, FYRMadagascarMalawiMalaysiaMaldivesMaliMaltaMarshall IslandsMauritaniaMauritiusMexicoMicronesia, Fed. Sts.Middle East & North AfricaMiddle East & North Africa (excluding high income)Middle East & North Africa (IDA & IBRD countries)Middle incomeMoldovaMonacoMongoliaMontenegroMoroccoMozambiqueMyanmarNamibiaNauruNepalNetherlandsNew ZealandNicaraguaNigerNigeriaNorth AmericaNorwayOECD membersOmanOther small statesPacific island small statesPakistanPanamaPapua New GuineaParaguayPeruPolandPortugalPost-demographic dividendPre-demographic dividendPuerto RicoQatarRomaniaRussian FederationRwandaSamoaSan MarinoSao Tome and PrincipeSaudi ArabiaSenegalSerbiaSeychellesSierra LeoneSingaporeSint Maarten (Dutch part)Slovak RepublicSloveniaSmall statesSolomon IslandsSomaliaSouth AfricaSouth AsiaSouth Asia (IDA & IBRD)SpainSri LankaSt. Kitts and NevisSt. LuciaSt. Vincent and the GrenadinesSub-Saharan Africa Sub-Saharan Africa (excluding high income)Sub-Saharan Africa (IDA & IBRD countries)SudanSurinameSwazilandSwedenSwitzerlandSyrian Arab RepublicTajikistanTanzaniaThailandTimor-LesteTogoTongaTrinidad and TobagoTunisiaTurkeyTurkmenistanTurks and Caicos IslandsTuvaluUgandaUkraineUnited Arab EmiratesUnited KingdomUpper middle incomeUruguayUzbekistanVanuatuVenezuela, RBVietnamWest Bank and GazaWorldYemen, Rep.ZambiaZimbabwe Timeline:
This timeline shows a graph from 1971 to 2015 of East Asia & Pacific. No data until 1970. Number of actual observations by date: 45.
Source name:
World Development Indicators
Source organization:
UNESCO Institute for Statistics
Categories, topics:
Education, Gender
Last updated:
apr 23, 2017
Indicators value changes by year
Minimum:
39.498
jan 1, 1971
Maximum:
48.908
jan 1, 2007
At the date of observation
Value
Absolute change
Change from previous value
jan 1, 1971
39.498
+39.498
0.0%
jan 1, 1972
39.959
+0.462
1.17%
jan 1, 1973
40.527
+0.567
1.42%
jan 1, 1974
40.483
-0.043
-0.11%
jan 1, 1975
40.234
-0.249
-0.62%
jan 1, 1976
40.414
+0.18
0.45%
jan 1, 1977
40.154
-0.26
-0.64%
jan 1, 1978
40.038
-0.115
-0.29%
jan 1, 1979
40.166
+0.127
0.32%
jan 1, 1980
40.293
+0.127
0.32%
jan 1, 1981
40.346
+0.053
0.13%
jan 1, 1982
40.528
+0.183
0.45%
jan 1, 1983
41.622
+1.094
2.7%
jan 1, 1984
42.241
+0.619
1.49%
jan 1, 1985
42.925
+0.684
1.62%
jan 1, 1986
42.746
-0.179
-0.42%
jan 1, 1987
40.963
-1.783
-4.17%
jan 1, 1988
44.388
+3.425
8.36%
jan 1, 1989
44.126
-0.261
-0.59%
jan 1, 1990
44.458
+0.331
0.75%
jan 1, 1991
41.699
-2.759
-6.21%
jan 1, 1992
41.242
-0.456
-1.09%
jan 1, 1993
41.403
+0.16
0.39%
jan 1, 1994
41.73
+0.327
0.79%
jan 1, 1995
45.044
+3.314
7.94%
jan 1, 1996
45.937
+0.893
1.98%
jan 1, 1997
46.707
+0.771
1.68%
jan 1, 1998
45.769
-0.938
-2.01%
jan 1, 1999
46.483
+0.714
1.56%
jan 1, 2000
47.162
+0.679
1.46%
jan 1, 2001
47.163
+0.001
0.0%
jan 1, 2002
47.165
+0.001
0.0%
jan 1, 2003
46.76
-0.404
-0.86%
jan 1, 2004
46.761
+0.0
0.0%
jan 1, 2005
47.696
+0.935
2.0%
jan 1, 2006
48.598
+0.902
1.89%
jan 1, 2007
48.908
+0.309
0.64%
jan 1, 2008
48.544
-0.364
-0.74%
jan 1, 2009
48.307
-0.237
-0.49%
jan 1, 2010
48.101
-0.206
-0.43%
jan 1, 2011
44.548
-3.553
-7.39%
jan 1, 2012
44.44
-0.108
-0.24%
jan 1, 2013
44.345
-0.095
-0.21%
jan 1, 2014
43.971
-0.373
-0.84%
jan 1, 2015
44.004
+0.033
0.07%
Ranking of countries by current statistics by years


Comments: