29
/
en
AIzaSyAYiBZKx7MnpbEhh9jyipgxe19OcubqV5w
April 1, 2024
151925
Hong Kong SAR, China
HKG
true
2
1
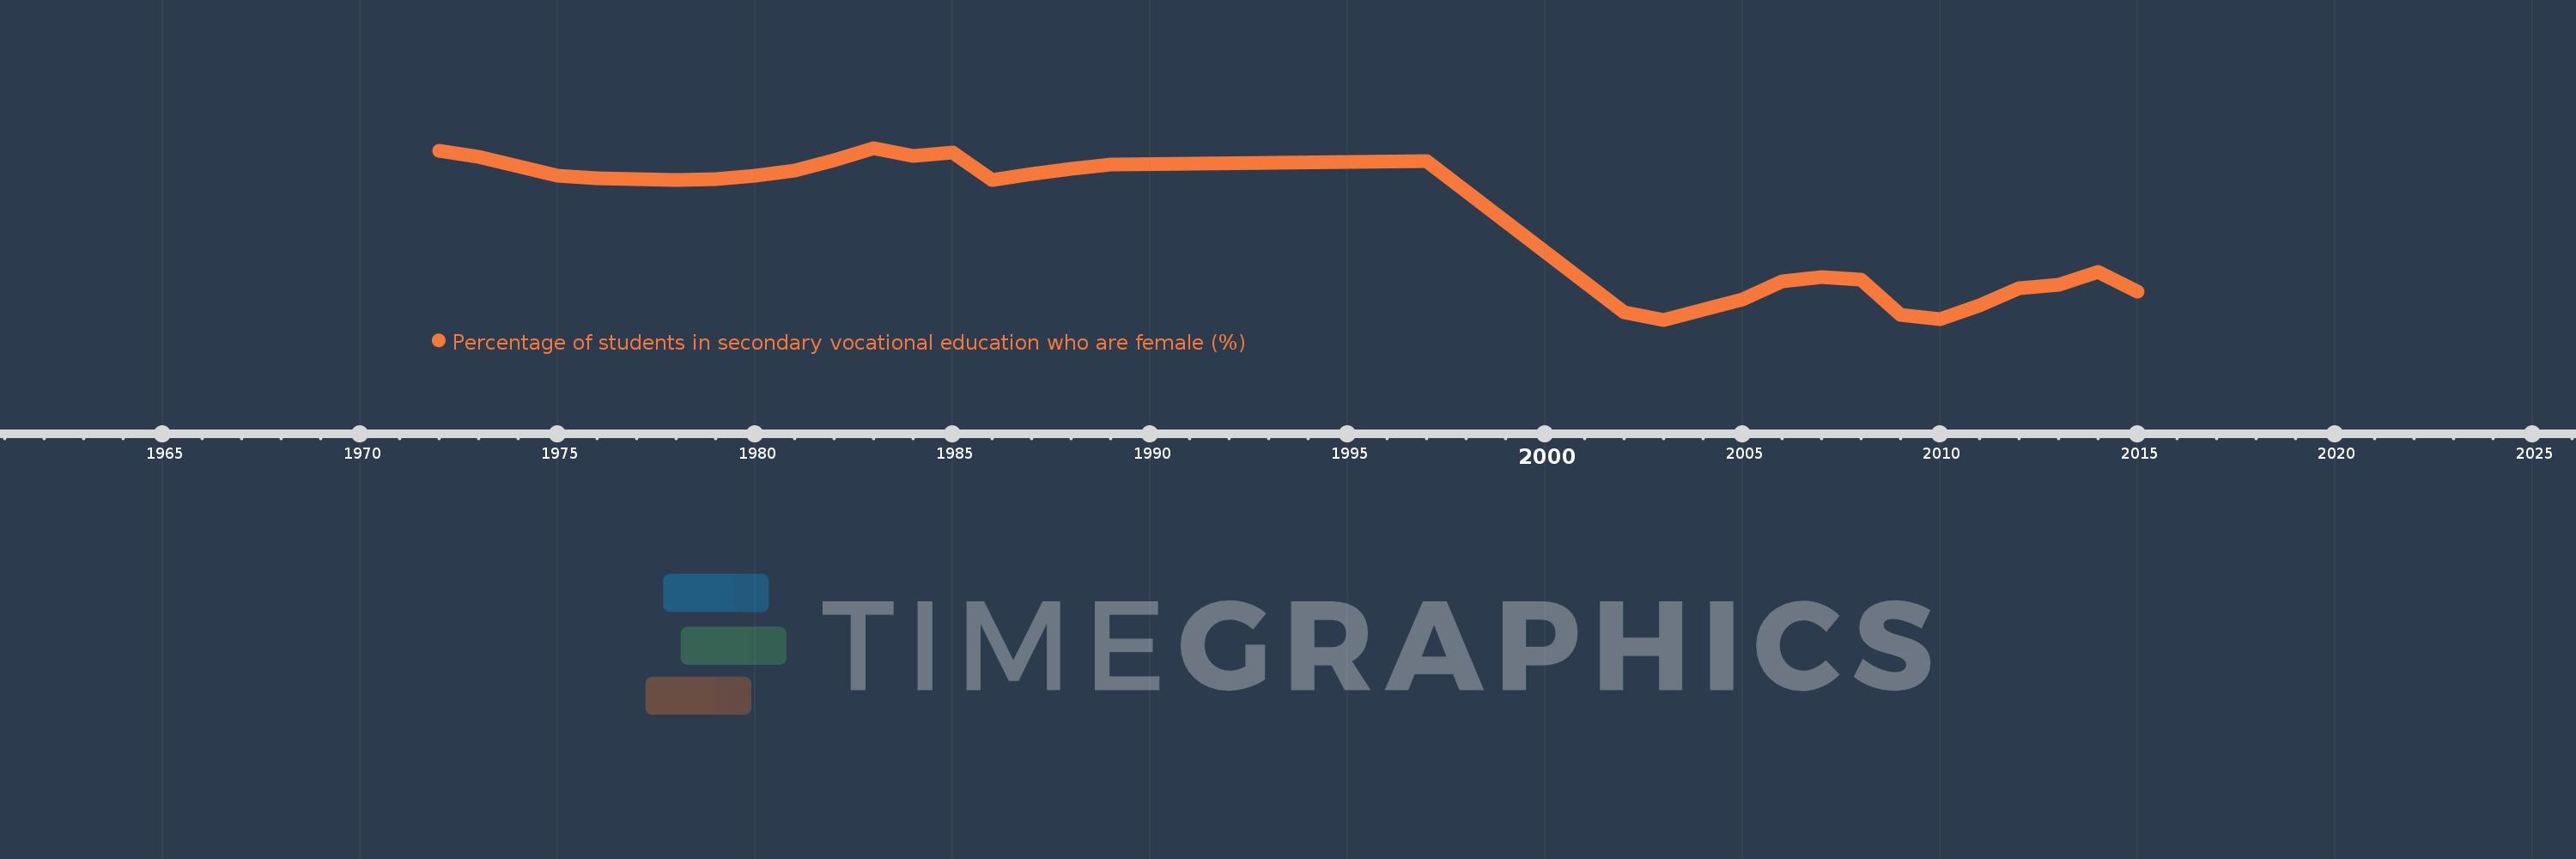
Percentage of students in secondary vocational education who are female (%)
2015,2014,2013,2012,2011,2010,2009,2008,2007,2006,2005,2004,2003,2002,1997,1989,1988,1987,1986,1985,1984,1983,1982,1981,1980,1979,1978,1977,1976,1975,1974,1973,1972
This statistics in other country:
AfghanistanAlbaniaAlgeriaAndorraAngolaAntigua and BarbudaArab WorldArgentinaArmeniaArubaAustraliaAustriaAzerbaijanBahrainBangladeshBarbadosBelarusBelgiumBelizeBeninBermudaBhutanBoliviaBosnia and HerzegovinaBotswanaBrazilBritish Virgin IslandsBrunei DarussalamBulgariaBurkina FasoBurundiCabo VerdeCambodiaCameroonCanadaCaribbean small statesCentral African RepublicCentral Europe and the BalticsChadChileChinaColombiaComorosCongo, Dem. Rep.Congo, Rep.Costa RicaCote d'IvoireCroatiaCubaCuracaoCyprusCzech RepublicDenmarkDjiboutiDominicaDominican RepublicEarly-demographic dividendEast Asia & PacificEast Asia & Pacific (excluding high income)East Asia & Pacific (IDA & IBRD countries)EcuadorEgypt, Arab Rep.El SalvadorEquatorial GuineaEritreaEstoniaEthiopiaEuro areaEurope & Central AsiaEurope & Central Asia (excluding high income)Europe & Central Asia (IDA & IBRD countries)European UnionFijiFinlandFragile and conflict affected situationsFranceGabonGambia, TheGeorgiaGermanyGhanaGibraltarGreeceGrenadaGuatemalaGuineaGuinea-BissauGuyanaHaitiHeavily indebted poor countries (HIPC)High incomeHondurasHong Kong SAR, ChinaHungaryIBRD onlyIcelandIDA & IBRD totalIDA blendIDA onlyIDA totalIndiaIndonesiaIran, Islamic Rep.IraqIrelandIsraelItalyJamaicaJapanJordanKazakhstanKenyaKiribatiKorea, Rep.KuwaitKyrgyz RepublicLao PDRLate-demographic dividendLatin America & Caribbean Latin America & Caribbean (excluding high income)Latin America & the Caribbean (IDA & IBRD countries)LatviaLeast developed countries: UN classificationLebanonLesothoLiberiaLibyaLiechtensteinLithuaniaLow & middle incomeLow incomeLower middle incomeLuxembourgMacao SAR, ChinaMacedonia, FYRMadagascarMalawiMalaysiaMaldivesMaliMaltaMarshall IslandsMauritaniaMauritiusMexicoMicronesia, Fed. Sts.Middle East & North AfricaMiddle East & North Africa (excluding high income)Middle East & North Africa (IDA & IBRD countries)Middle incomeMoldovaMonacoMongoliaMontenegroMoroccoMozambiqueMyanmarNamibiaNauruNepalNetherlandsNew ZealandNicaraguaNigerNigeriaNorth AmericaNorwayOECD membersOmanOther small statesPacific island small statesPakistanPanamaPapua New GuineaParaguayPeruPolandPortugalPost-demographic dividendPre-demographic dividendPuerto RicoQatarRomaniaRussian FederationRwandaSamoaSan MarinoSao Tome and PrincipeSaudi ArabiaSenegalSerbiaSeychellesSierra LeoneSingaporeSint Maarten (Dutch part)Slovak RepublicSloveniaSmall statesSolomon IslandsSomaliaSouth AfricaSouth AsiaSouth Asia (IDA & IBRD)SpainSri LankaSt. Kitts and NevisSt. LuciaSt. Vincent and the GrenadinesSub-Saharan Africa Sub-Saharan Africa (excluding high income)Sub-Saharan Africa (IDA & IBRD countries)SudanSurinameSwazilandSwedenSwitzerlandSyrian Arab RepublicTajikistanTanzaniaThailandTimor-LesteTogoTongaTrinidad and TobagoTunisiaTurkeyTurkmenistanTurks and Caicos IslandsTuvaluUgandaUkraineUnited Arab EmiratesUnited KingdomUpper middle incomeUruguayUzbekistanVanuatuVenezuela, RBVietnamWest Bank and GazaWorldYemen, Rep.ZambiaZimbabwe Timeline:
This timeline shows a graph from 1972 to 2015 of Hong Kong SAR, China. No data until 1971. Number of actual observations by date: 33.
Source name:
World Development Indicators
Source organization:
UNESCO Institute for Statistics
Categories, topics:
Education, Gender
Last updated:
apr 23, 2017
Indicators value changes by year
Maximum:
33.848
jan 1, 1983
At the date of observation
Value
Absolute change
Change from previous value
jan 1, 1972
33.466
+33.466
0.0%
jan 1, 1973
32.528
-0.937
-2.8%
jan 1, 1974
31.235
-1.293
-3.98%
jan 1, 1975
29.84
-1.395
-4.47%
jan 1, 1976
29.528
-0.312
-1.05%
jan 1, 1977
29.392
-0.135
-0.46%
jan 1, 1978
29.318
-0.074
-0.25%
jan 1, 1979
29.391
+0.072
0.25%
jan 1, 1980
29.9
+0.509
1.73%
jan 1, 1981
30.618
+0.718
2.4%
jan 1, 1982
32.103
+1.485
4.85%
jan 1, 1983
33.848
+1.745
5.44%
jan 1, 1984
32.663
-1.185
-3.5%
jan 1, 1985
33.168
+0.504
1.54%
jan 1, 1986
29.317
-3.85
-11.61%
jan 1, 1987
30.162
+0.845
2.88%
jan 1, 1988
30.931
+0.768
2.55%
jan 1, 1989
31.528
+0.598
1.93%
jan 1, 1997
32.028
+0.5
1.59%
jan 1, 2002
10.446
-21.582
-67.38%
jan 1, 2003
9.374
-1.072
-10.26%
jan 1, 2004
10.767
+1.392
14.85%
jan 1, 2005
12.31
+1.544
14.34%
jan 1, 2006
14.794
+2.483
20.17%
jan 1, 2007
15.431
+0.637
4.31%
jan 1, 2008
15.038
-0.393
-2.55%
jan 1, 2009
10.047
-4.991
-33.19%
jan 1, 2010
9.506
-0.541
-5.38%
jan 1, 2011
11.426
+1.92
20.2%
jan 1, 2012
13.865
+2.439
21.35%
jan 1, 2013
14.413
+0.548
3.95%
jan 1, 2014
16.158
+1.745
12.11%
jan 1, 2015
13.399
-2.759
-17.07%
Ranking of countries by current statistics by years


Comments: