29
/
en
AIzaSyAYiBZKx7MnpbEhh9jyipgxe19OcubqV5w
April 1, 2024
57445
South Asia
SAS
false
2
1
Percentage of students in secondary vocational education who are female (%)
2015,2014,2013,2012,2011,2010,2009,2008,2007,2006,2005,2004,2003,2002,2001,2000,1999,1998,1997,1996,1995,1994,1993,1992,1991,1990,1989,1988,1987,1986,1985,1984,1983,1982,1981,1980,1979,1978,1977,1976,1975,1974,1973,1972,1971
This statistics in other country:
AfghanistanAlbaniaAlgeriaAndorraAngolaAntigua and BarbudaArab WorldArgentinaArmeniaArubaAustraliaAustriaAzerbaijanBahrainBangladeshBarbadosBelarusBelgiumBelizeBeninBermudaBhutanBoliviaBosnia and HerzegovinaBotswanaBrazilBritish Virgin IslandsBrunei DarussalamBulgariaBurkina FasoBurundiCabo VerdeCambodiaCameroonCanadaCaribbean small statesCentral African RepublicCentral Europe and the BalticsChadChileChinaColombiaComorosCongo, Dem. Rep.Congo, Rep.Costa RicaCote d'IvoireCroatiaCubaCuracaoCyprusCzech RepublicDenmarkDjiboutiDominicaDominican RepublicEarly-demographic dividendEast Asia & PacificEast Asia & Pacific (excluding high income)East Asia & Pacific (IDA & IBRD countries)EcuadorEgypt, Arab Rep.El SalvadorEquatorial GuineaEritreaEstoniaEthiopiaEuro areaEurope & Central AsiaEurope & Central Asia (excluding high income)Europe & Central Asia (IDA & IBRD countries)European UnionFijiFinlandFragile and conflict affected situationsFranceGabonGambia, TheGeorgiaGermanyGhanaGibraltarGreeceGrenadaGuatemalaGuineaGuinea-BissauGuyanaHaitiHeavily indebted poor countries (HIPC)High incomeHondurasHong Kong SAR, ChinaHungaryIBRD onlyIcelandIDA & IBRD totalIDA blendIDA onlyIDA totalIndiaIndonesiaIran, Islamic Rep.IraqIrelandIsraelItalyJamaicaJapanJordanKazakhstanKenyaKiribatiKorea, Rep.KuwaitKyrgyz RepublicLao PDRLate-demographic dividendLatin America & Caribbean Latin America & Caribbean (excluding high income)Latin America & the Caribbean (IDA & IBRD countries)LatviaLeast developed countries: UN classificationLebanonLesothoLiberiaLibyaLiechtensteinLithuaniaLow & middle incomeLow incomeLower middle incomeLuxembourgMacao SAR, ChinaMacedonia, FYRMadagascarMalawiMalaysiaMaldivesMaliMaltaMarshall IslandsMauritaniaMauritiusMexicoMicronesia, Fed. Sts.Middle East & North AfricaMiddle East & North Africa (excluding high income)Middle East & North Africa (IDA & IBRD countries)Middle incomeMoldovaMonacoMongoliaMontenegroMoroccoMozambiqueMyanmarNamibiaNauruNepalNetherlandsNew ZealandNicaraguaNigerNigeriaNorth AmericaNorwayOECD membersOmanOther small statesPacific island small statesPakistanPanamaPapua New GuineaParaguayPeruPolandPortugalPost-demographic dividendPre-demographic dividendPuerto RicoQatarRomaniaRussian FederationRwandaSamoaSan MarinoSao Tome and PrincipeSaudi ArabiaSenegalSerbiaSeychellesSierra LeoneSingaporeSint Maarten (Dutch part)Slovak RepublicSloveniaSmall statesSolomon IslandsSomaliaSouth AfricaSouth AsiaSouth Asia (IDA & IBRD)SpainSri LankaSt. Kitts and NevisSt. LuciaSt. Vincent and the GrenadinesSub-Saharan Africa Sub-Saharan Africa (excluding high income)Sub-Saharan Africa (IDA & IBRD countries)SudanSurinameSwazilandSwedenSwitzerlandSyrian Arab RepublicTajikistanTanzaniaThailandTimor-LesteTogoTongaTrinidad and TobagoTunisiaTurkeyTurkmenistanTurks and Caicos IslandsTuvaluUgandaUkraineUnited Arab EmiratesUnited KingdomUpper middle incomeUruguayUzbekistanVanuatuVenezuela, RBVietnamWest Bank and GazaWorldYemen, Rep.ZambiaZimbabwe Timeline:
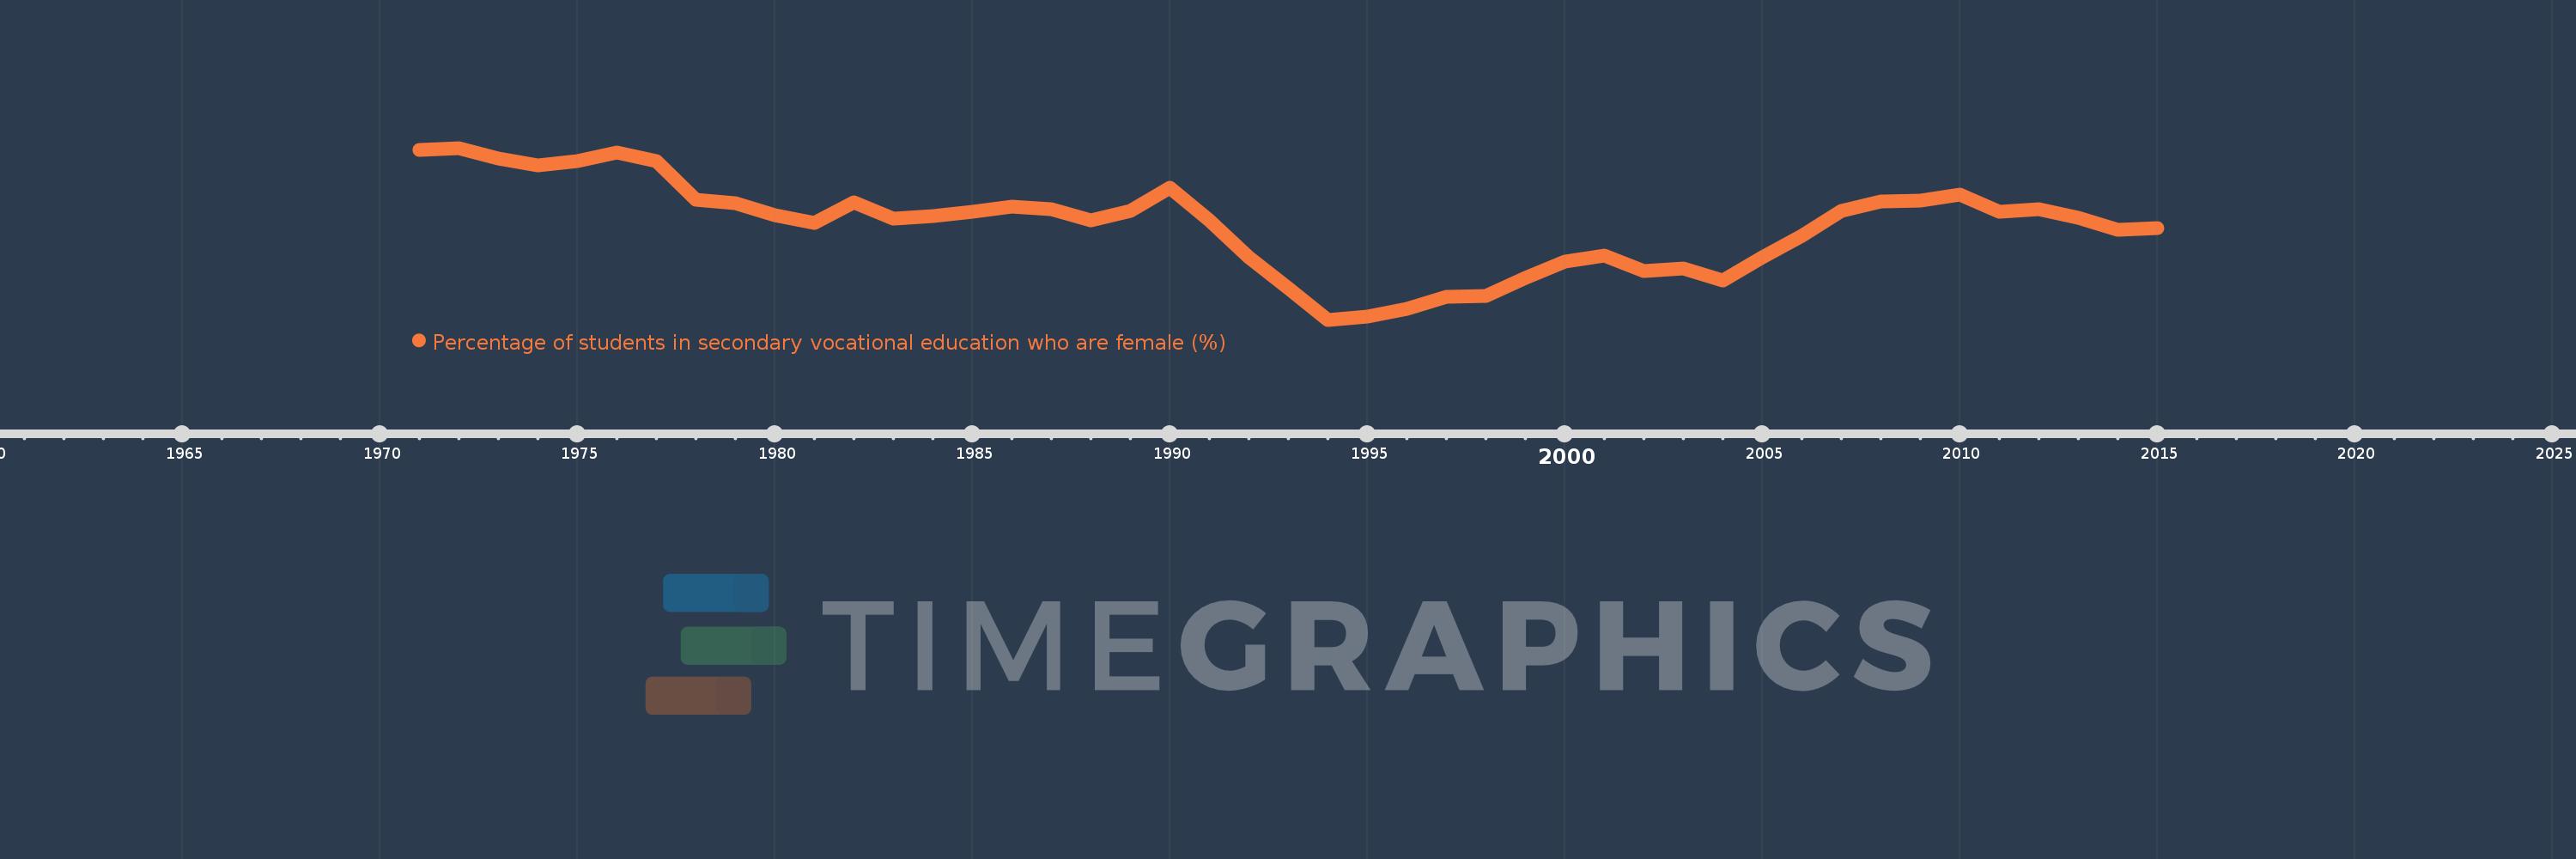
This timeline shows a graph from 1971 to 2015 of South Asia. No data until 1970. Number of actual observations by date: 45.
Source name:
World Development Indicators
Source organization:
UNESCO Institute for Statistics
Categories, topics:
Education, Gender
Last updated:
apr 23, 2017
Indicators value changes by year
Minimum:
14.404
jan 1, 1994
Maximum:
35.197
jan 1, 1972
At the date of observation
Value
Absolute change
Change from previous value
jan 1, 1971
34.951
+34.951
0.0%
jan 1, 1972
35.197
+0.246
0.7%
jan 1, 1973
33.962
-1.235
-3.51%
jan 1, 1974
33.126
-0.836
-2.46%
jan 1, 1975
33.621
+0.494
1.49%
jan 1, 1976
34.663
+1.042
3.1%
jan 1, 1977
33.556
-1.107
-3.19%
jan 1, 1978
28.911
-4.645
-13.84%
jan 1, 1979
28.563
-0.347
-1.2%
jan 1, 1980
27.098
-1.465
-5.13%
jan 1, 1981
26.131
-0.967
-3.57%
jan 1, 1982
28.592
+2.461
9.42%
jan 1, 1983
26.6
-1.992
-6.97%
jan 1, 1984
26.99
+0.39
1.47%
jan 1, 1985
27.48
+0.49
1.81%
jan 1, 1986
28.133
+0.653
2.38%
jan 1, 1987
27.77
-0.363
-1.29%
jan 1, 1988
26.442
-1.328
-4.78%
jan 1, 1989
27.581
+1.138
4.31%
jan 1, 1990
30.425
+2.845
10.31%
jan 1, 1991
26.404
-4.021
-13.22%
jan 1, 1992
21.954
-4.45
-16.85%
jan 1, 1993
18.183
-3.771
-17.18%
jan 1, 1994
14.404
-3.779
-20.78%
jan 1, 1995
14.804
+0.4
2.77%
jan 1, 1996
15.754
+0.95
6.42%
jan 1, 1997
17.15
+1.396
8.86%
jan 1, 1998
17.273
+0.123
0.72%
jan 1, 1999
19.416
+2.142
12.4%
jan 1, 2000
21.442
+2.026
10.44%
jan 1, 2001
22.134
+0.692
3.23%
jan 1, 2002
20.281
-1.854
-8.37%
jan 1, 2003
20.649
+0.369
1.82%
jan 1, 2004
19.109
-1.541
-7.46%
jan 1, 2005
22.009
+2.9
15.18%
jan 1, 2006
24.599
+2.59
11.77%
jan 1, 2007
27.605
+3.006
12.22%
jan 1, 2008
28.68
+1.074
3.89%
jan 1, 2009
28.797
+0.117
0.41%
jan 1, 2010
29.585
+0.789
2.74%
jan 1, 2011
27.498
-2.088
-7.06%
jan 1, 2012
27.735
+0.238
0.86%
jan 1, 2013
26.697
-1.038
-3.74%
jan 1, 2014
25.337
-1.359
-5.09%
jan 1, 2015
25.495
+0.158
0.62%
Ranking of countries by current statistics by years


Comments: