29
/
en
AIzaSyAYiBZKx7MnpbEhh9jyipgxe19OcubqV5w
April 1, 2024
182445
Luxembourg
LUX
true
2
1
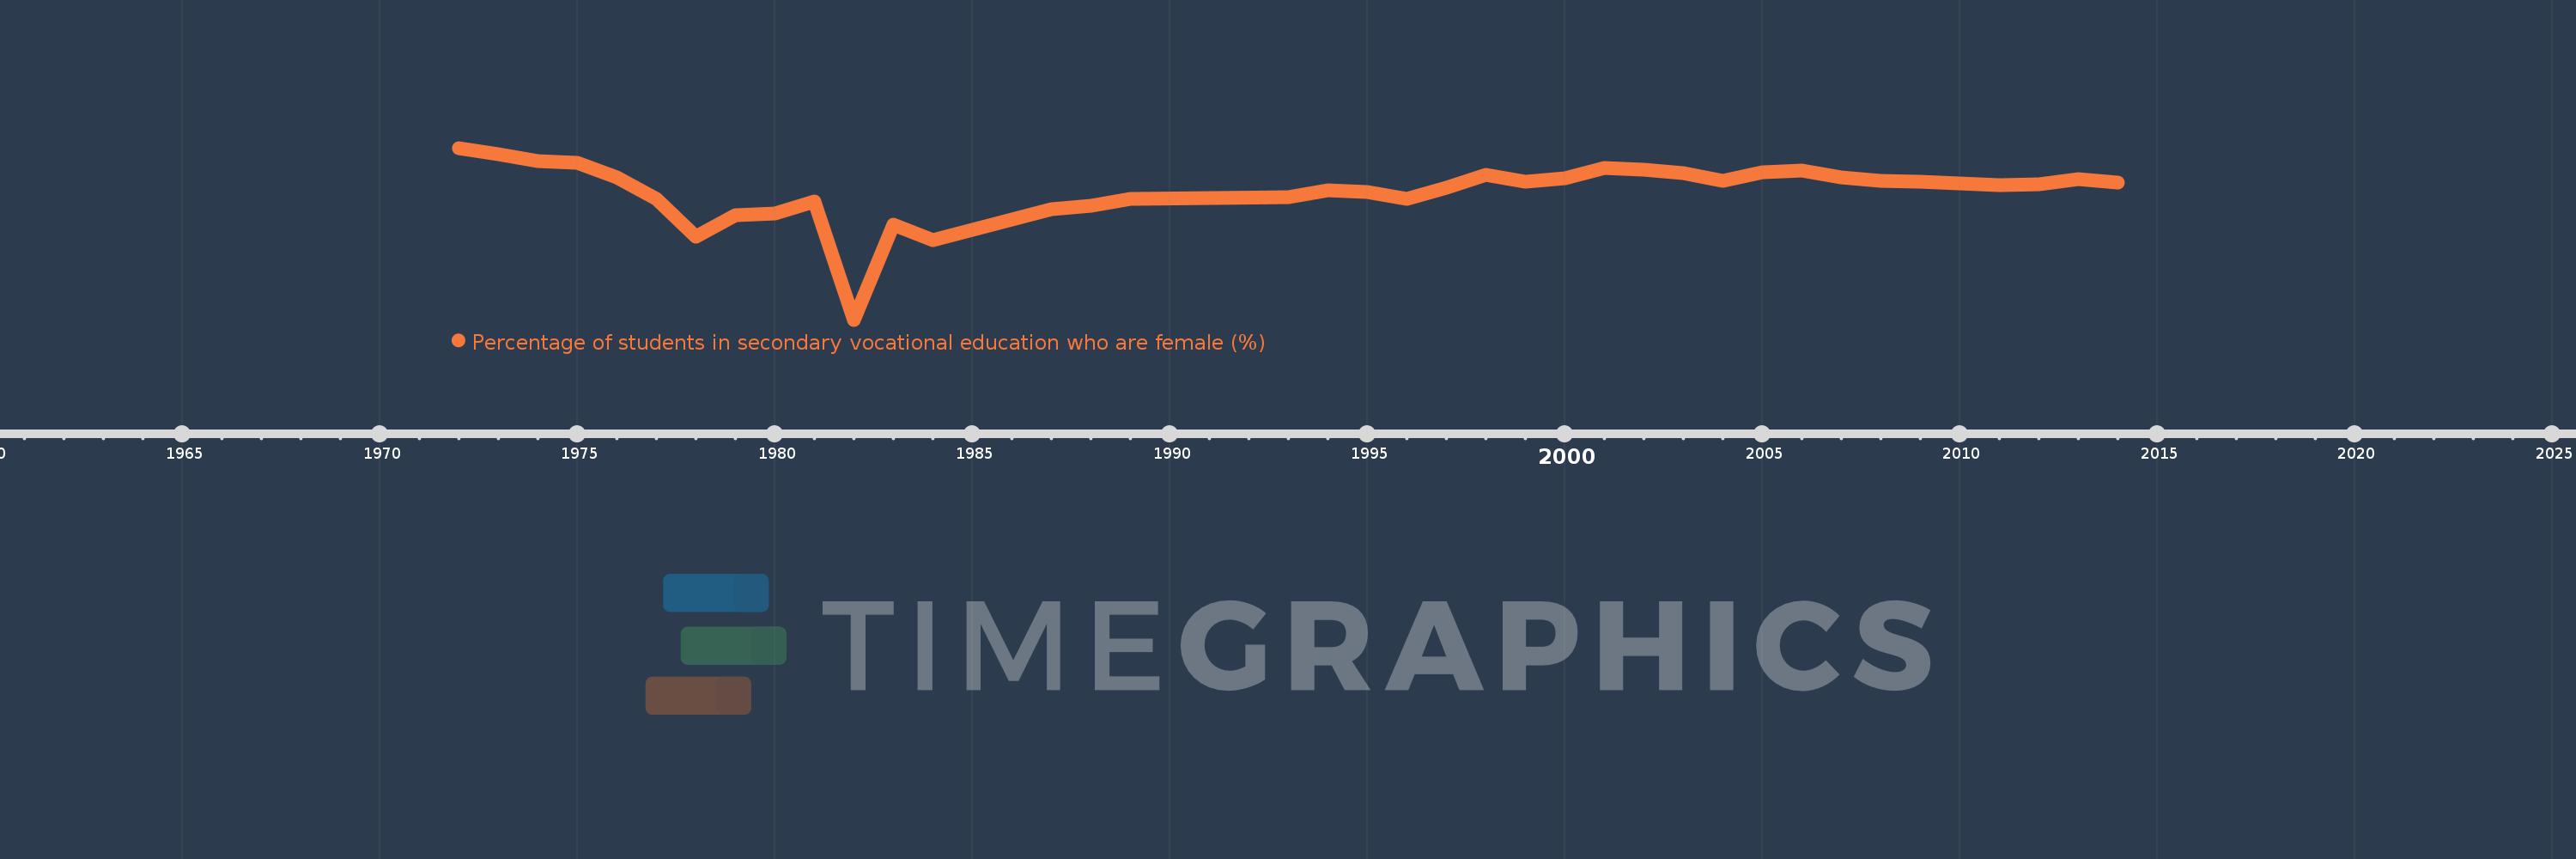
Percentage of students in secondary vocational education who are female (%)
2014,2013,2012,2011,2009,2008,2007,2006,2005,2004,2003,2002,2001,2000,1999,1998,1997,1996,1995,1994,1993,1989,1988,1987,1984,1983,1982,1981,1980,1979,1978,1977,1976,1975,1974,1973,1972
This statistics in other country:
AfghanistanAlbaniaAlgeriaAndorraAngolaAntigua and BarbudaArab WorldArgentinaArmeniaArubaAustraliaAustriaAzerbaijanBahrainBangladeshBarbadosBelarusBelgiumBelizeBeninBermudaBhutanBoliviaBosnia and HerzegovinaBotswanaBrazilBritish Virgin IslandsBrunei DarussalamBulgariaBurkina FasoBurundiCabo VerdeCambodiaCameroonCanadaCaribbean small statesCentral African RepublicCentral Europe and the BalticsChadChileChinaColombiaComorosCongo, Dem. Rep.Congo, Rep.Costa RicaCote d'IvoireCroatiaCubaCuracaoCyprusCzech RepublicDenmarkDjiboutiDominicaDominican RepublicEarly-demographic dividendEast Asia & PacificEast Asia & Pacific (excluding high income)East Asia & Pacific (IDA & IBRD countries)EcuadorEgypt, Arab Rep.El SalvadorEquatorial GuineaEritreaEstoniaEthiopiaEuro areaEurope & Central AsiaEurope & Central Asia (excluding high income)Europe & Central Asia (IDA & IBRD countries)European UnionFijiFinlandFragile and conflict affected situationsFranceGabonGambia, TheGeorgiaGermanyGhanaGibraltarGreeceGrenadaGuatemalaGuineaGuinea-BissauGuyanaHaitiHeavily indebted poor countries (HIPC)High incomeHondurasHong Kong SAR, ChinaHungaryIBRD onlyIcelandIDA & IBRD totalIDA blendIDA onlyIDA totalIndiaIndonesiaIran, Islamic Rep.IraqIrelandIsraelItalyJamaicaJapanJordanKazakhstanKenyaKiribatiKorea, Rep.KuwaitKyrgyz RepublicLao PDRLate-demographic dividendLatin America & Caribbean Latin America & Caribbean (excluding high income)Latin America & the Caribbean (IDA & IBRD countries)LatviaLeast developed countries: UN classificationLebanonLesothoLiberiaLibyaLiechtensteinLithuaniaLow & middle incomeLow incomeLower middle incomeLuxembourgMacao SAR, ChinaMacedonia, FYRMadagascarMalawiMalaysiaMaldivesMaliMaltaMarshall IslandsMauritaniaMauritiusMexicoMicronesia, Fed. Sts.Middle East & North AfricaMiddle East & North Africa (excluding high income)Middle East & North Africa (IDA & IBRD countries)Middle incomeMoldovaMonacoMongoliaMontenegroMoroccoMozambiqueMyanmarNamibiaNauruNepalNetherlandsNew ZealandNicaraguaNigerNigeriaNorth AmericaNorwayOECD membersOmanOther small statesPacific island small statesPakistanPanamaPapua New GuineaParaguayPeruPolandPortugalPost-demographic dividendPre-demographic dividendPuerto RicoQatarRomaniaRussian FederationRwandaSamoaSan MarinoSao Tome and PrincipeSaudi ArabiaSenegalSerbiaSeychellesSierra LeoneSingaporeSint Maarten (Dutch part)Slovak RepublicSloveniaSmall statesSolomon IslandsSomaliaSouth AfricaSouth AsiaSouth Asia (IDA & IBRD)SpainSri LankaSt. Kitts and NevisSt. LuciaSt. Vincent and the GrenadinesSub-Saharan Africa Sub-Saharan Africa (excluding high income)Sub-Saharan Africa (IDA & IBRD countries)SudanSurinameSwazilandSwedenSwitzerlandSyrian Arab RepublicTajikistanTanzaniaThailandTimor-LesteTogoTongaTrinidad and TobagoTunisiaTurkeyTurkmenistanTurks and Caicos IslandsTuvaluUgandaUkraineUnited Arab EmiratesUnited KingdomUpper middle incomeUruguayUzbekistanVanuatuVenezuela, RBVietnamWest Bank and GazaWorldYemen, Rep.ZambiaZimbabwe Timeline:
This timeline shows a graph from 1972 to 2014 of Luxembourg. No data until 1971. Number of actual observations by date: 37.
Source name:
World Development Indicators
Source organization:
UNESCO Institute for Statistics
Categories, topics:
Education, Gender
Last updated:
apr 23, 2017
Indicators value changes by year
Minimum:
37.415
jan 1, 1982
Maximum:
50.253
jan 1, 1972
At the date of observation
Value
Absolute change
Change from previous value
jan 1, 1972
50.253
+50.253
0.0%
jan 1, 1973
49.761
-0.493
-0.98%
jan 1, 1974
49.245
-0.516
-1.04%
jan 1, 1975
49.133
-0.112
-0.23%
jan 1, 1976
48.057
-1.076
-2.19%
jan 1, 1977
46.442
-1.615
-3.36%
jan 1, 1978
43.623
-2.819
-6.07%
jan 1, 1979
45.218
+1.596
3.66%
jan 1, 1980
45.341
+0.122
0.27%
jan 1, 1981
46.237
+0.896
1.98%
jan 1, 1982
37.415
-8.822
-19.08%
jan 1, 1983
44.53
+7.115
19.02%
jan 1, 1984
43.38
-1.15
-2.58%
jan 1, 1987
45.654
+2.274
5.24%
jan 1, 1988
45.933
+0.279
0.61%
jan 1, 1989
46.457
+0.525
1.14%
jan 1, 1993
46.584
+0.127
0.27%
jan 1, 1994
47.099
+0.515
1.1%
jan 1, 1995
46.958
-0.14
-0.3%
jan 1, 1996
46.46
-0.498
-1.06%
jan 1, 1997
47.278
+0.818
1.76%
jan 1, 1998
48.234
+0.956
2.02%
jan 1, 1999
47.754
-0.479
-0.99%
jan 1, 2000
48.014
+0.259
0.54%
jan 1, 2001
48.77
+0.756
1.58%
jan 1, 2002
48.648
-0.122
-0.25%
jan 1, 2003
48.351
-0.297
-0.61%
jan 1, 2004
47.794
-0.558
-1.15%
jan 1, 2005
48.43
+0.636
1.33%
jan 1, 2006
48.566
+0.136
0.28%
jan 1, 2007
48.031
-0.536
-1.1%
jan 1, 2008
47.784
-0.247
-0.51%
jan 1, 2009
47.704
-0.079
-0.17%
jan 1, 2011
47.486
-0.218
-0.46%
jan 1, 2012
47.55
+0.064
0.14%
jan 1, 2013
47.904
+0.354
0.74%
jan 1, 2014
47.646
-0.258
-0.54%
Ranking of countries by current statistics by years


Comments: