29
/
en
AIzaSyAYiBZKx7MnpbEhh9jyipgxe19OcubqV5w
April 1, 2024
51278
Middle income
MIC
false
2
1
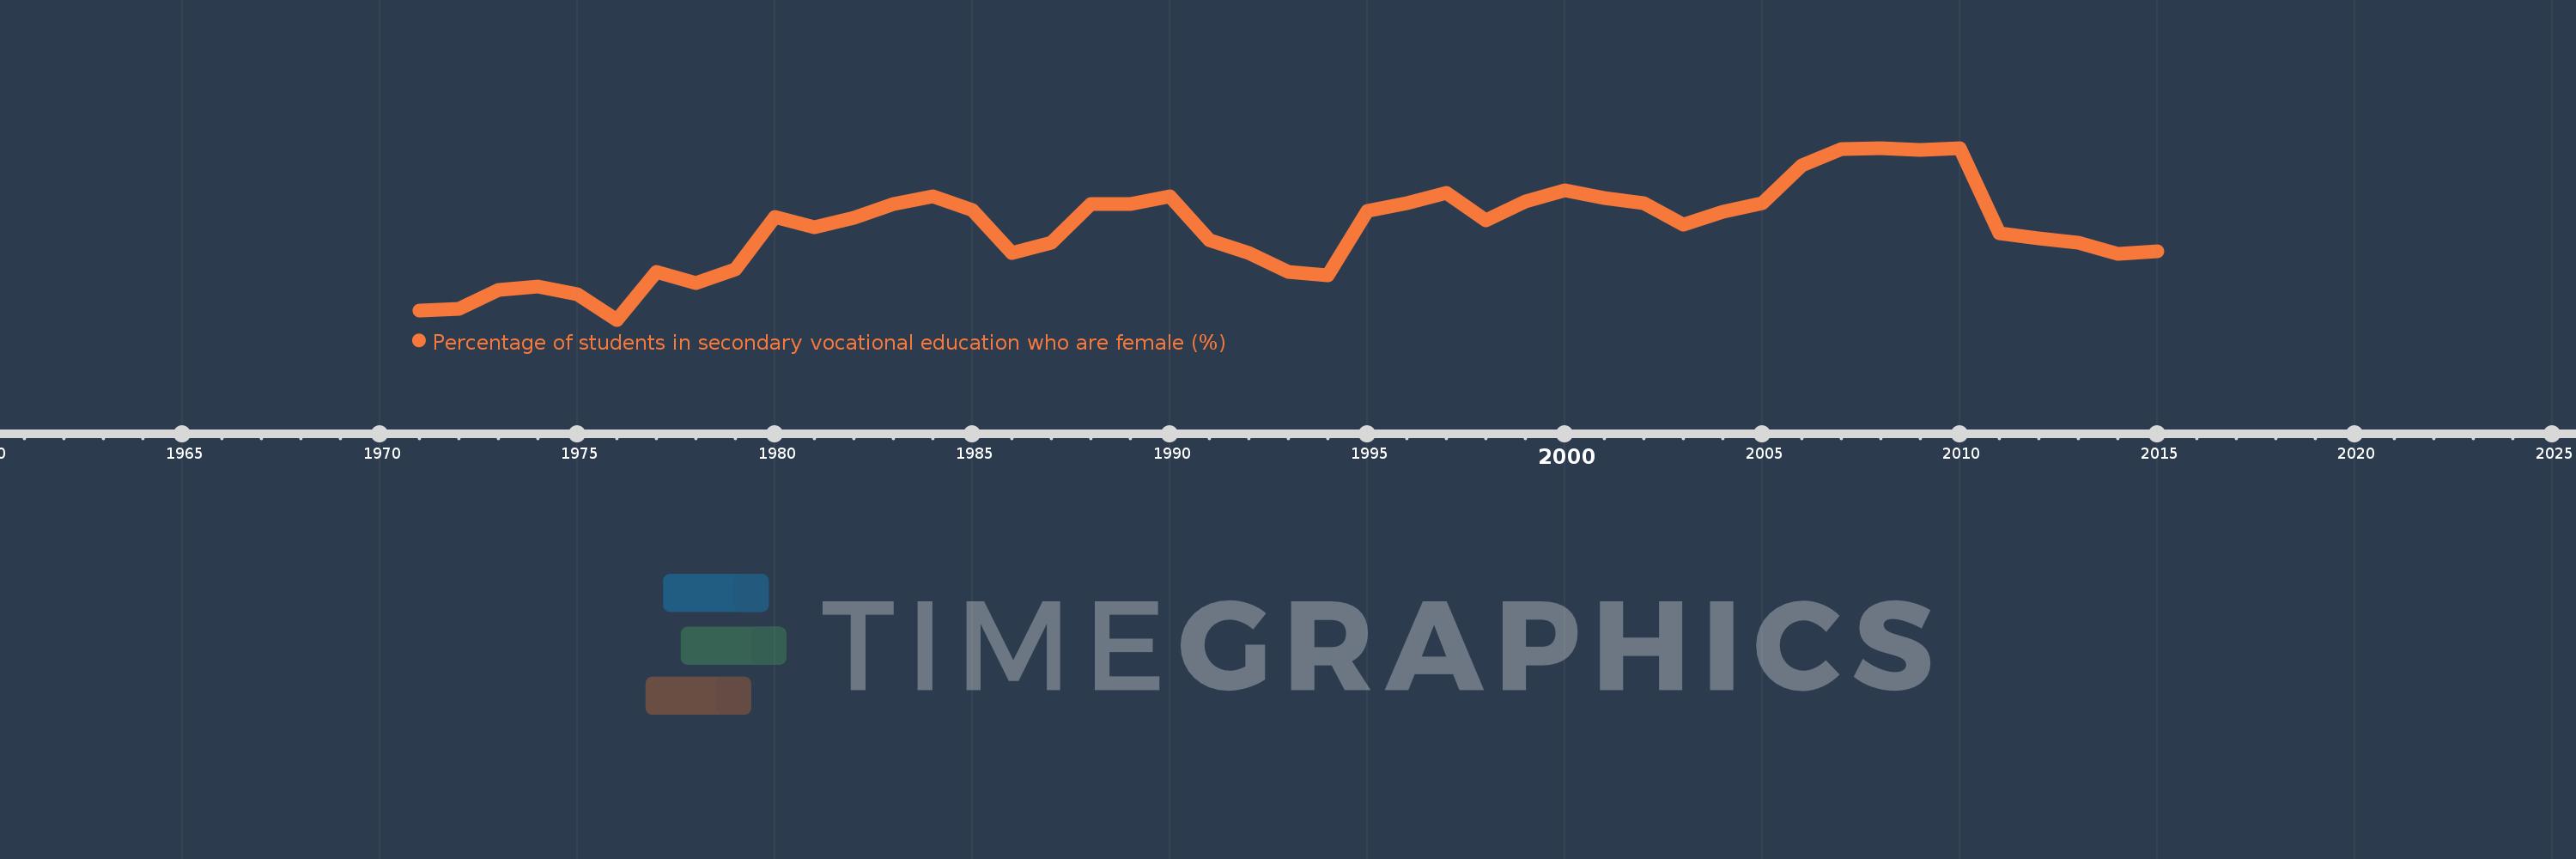
Percentage of students in secondary vocational education who are female (%)
2015,2014,2013,2012,2011,2010,2009,2008,2007,2006,2005,2004,2003,2002,2001,2000,1999,1998,1997,1996,1995,1994,1993,1992,1991,1990,1989,1988,1987,1986,1985,1984,1983,1982,1981,1980,1979,1978,1977,1976,1975,1974,1973,1972,1971
This statistics in other country:
AfghanistanAlbaniaAlgeriaAndorraAngolaAntigua and BarbudaArab WorldArgentinaArmeniaArubaAustraliaAustriaAzerbaijanBahrainBangladeshBarbadosBelarusBelgiumBelizeBeninBermudaBhutanBoliviaBosnia and HerzegovinaBotswanaBrazilBritish Virgin IslandsBrunei DarussalamBulgariaBurkina FasoBurundiCabo VerdeCambodiaCameroonCanadaCaribbean small statesCentral African RepublicCentral Europe and the BalticsChadChileChinaColombiaComorosCongo, Dem. Rep.Congo, Rep.Costa RicaCote d'IvoireCroatiaCubaCuracaoCyprusCzech RepublicDenmarkDjiboutiDominicaDominican RepublicEarly-demographic dividendEast Asia & PacificEast Asia & Pacific (excluding high income)East Asia & Pacific (IDA & IBRD countries)EcuadorEgypt, Arab Rep.El SalvadorEquatorial GuineaEritreaEstoniaEthiopiaEuro areaEurope & Central AsiaEurope & Central Asia (excluding high income)Europe & Central Asia (IDA & IBRD countries)European UnionFijiFinlandFragile and conflict affected situationsFranceGabonGambia, TheGeorgiaGermanyGhanaGibraltarGreeceGrenadaGuatemalaGuineaGuinea-BissauGuyanaHaitiHeavily indebted poor countries (HIPC)High incomeHondurasHong Kong SAR, ChinaHungaryIBRD onlyIcelandIDA & IBRD totalIDA blendIDA onlyIDA totalIndiaIndonesiaIran, Islamic Rep.IraqIrelandIsraelItalyJamaicaJapanJordanKazakhstanKenyaKiribatiKorea, Rep.KuwaitKyrgyz RepublicLao PDRLate-demographic dividendLatin America & Caribbean Latin America & Caribbean (excluding high income)Latin America & the Caribbean (IDA & IBRD countries)LatviaLeast developed countries: UN classificationLebanonLesothoLiberiaLibyaLiechtensteinLithuaniaLow & middle incomeLow incomeLower middle incomeLuxembourgMacao SAR, ChinaMacedonia, FYRMadagascarMalawiMalaysiaMaldivesMaliMaltaMarshall IslandsMauritaniaMauritiusMexicoMicronesia, Fed. Sts.Middle East & North AfricaMiddle East & North Africa (excluding high income)Middle East & North Africa (IDA & IBRD countries)Middle incomeMoldovaMonacoMongoliaMontenegroMoroccoMozambiqueMyanmarNamibiaNauruNepalNetherlandsNew ZealandNicaraguaNigerNigeriaNorth AmericaNorwayOECD membersOmanOther small statesPacific island small statesPakistanPanamaPapua New GuineaParaguayPeruPolandPortugalPost-demographic dividendPre-demographic dividendPuerto RicoQatarRomaniaRussian FederationRwandaSamoaSan MarinoSao Tome and PrincipeSaudi ArabiaSenegalSerbiaSeychellesSierra LeoneSingaporeSint Maarten (Dutch part)Slovak RepublicSloveniaSmall statesSolomon IslandsSomaliaSouth AfricaSouth AsiaSouth Asia (IDA & IBRD)SpainSri LankaSt. Kitts and NevisSt. LuciaSt. Vincent and the GrenadinesSub-Saharan Africa Sub-Saharan Africa (excluding high income)Sub-Saharan Africa (IDA & IBRD countries)SudanSurinameSwazilandSwedenSwitzerlandSyrian Arab RepublicTajikistanTanzaniaThailandTimor-LesteTogoTongaTrinidad and TobagoTunisiaTurkeyTurkmenistanTurks and Caicos IslandsTuvaluUgandaUkraineUnited Arab EmiratesUnited KingdomUpper middle incomeUruguayUzbekistanVanuatuVenezuela, RBVietnamWest Bank and GazaWorldYemen, Rep.ZambiaZimbabwe Timeline:
This timeline shows a graph from 1971 to 2015 of Middle income. No data until 1970. Number of actual observations by date: 45.
Source name:
World Development Indicators
Source organization:
UNESCO Institute for Statistics
Categories, topics:
Education, Gender
Last updated:
apr 23, 2017
Indicators value changes by year
Minimum:
41.539
jan 1, 1976
Maximum:
46.467
jan 1, 2008
At the date of observation
Value
Absolute change
Change from previous value
jan 1, 1971
41.8
+41.8
0.0%
jan 1, 1972
41.851
+0.051
0.12%
jan 1, 1973
42.385
+0.534
1.28%
jan 1, 1974
42.503
+0.118
0.28%
jan 1, 1975
42.275
-0.228
-0.54%
jan 1, 1976
41.539
-0.736
-1.74%
jan 1, 1977
42.903
+1.365
3.29%
jan 1, 1978
42.583
-0.32
-0.75%
jan 1, 1979
42.98
+0.397
0.93%
jan 1, 1980
44.478
+1.498
3.49%
jan 1, 1981
44.201
-0.277
-0.62%
jan 1, 1982
44.452
+0.251
0.57%
jan 1, 1983
44.867
+0.415
0.93%
jan 1, 1984
45.092
+0.225
0.5%
jan 1, 1985
44.689
-0.403
-0.89%
jan 1, 1986
43.46
-1.229
-2.75%
jan 1, 1987
43.745
+0.284
0.65%
jan 1, 1988
44.868
+1.124
2.57%
jan 1, 1989
44.865
-0.004
-0.01%
jan 1, 1990
45.077
+0.213
0.47%
jan 1, 1991
43.813
-1.264
-2.8%
jan 1, 1992
43.444
-0.369
-0.84%
jan 1, 1993
42.907
-0.537
-1.24%
jan 1, 1994
42.816
-0.091
-0.21%
jan 1, 1995
44.651
+1.834
4.28%
jan 1, 1996
44.888
+0.237
0.53%
jan 1, 1997
45.189
+0.302
0.67%
jan 1, 1998
44.383
-0.807
-1.79%
jan 1, 1999
44.936
+0.553
1.25%
jan 1, 2000
45.241
+0.305
0.68%
jan 1, 2001
45.035
-0.206
-0.45%
jan 1, 2002
44.891
-0.144
-0.32%
jan 1, 2003
44.276
-0.616
-1.37%
jan 1, 2004
44.627
+0.352
0.79%
jan 1, 2005
44.886
+0.259
0.58%
jan 1, 2006
45.976
+1.09
2.43%
jan 1, 2007
46.435
+0.459
1.0%
jan 1, 2008
46.467
+0.033
0.07%
jan 1, 2009
46.411
-0.056
-0.12%
jan 1, 2010
46.452
+0.041
0.09%
jan 1, 2011
44.027
-2.425
-5.22%
jan 1, 2012
43.861
-0.166
-0.38%
jan 1, 2013
43.746
-0.114
-0.26%
jan 1, 2014
43.436
-0.31
-0.71%
jan 1, 2015
43.508
+0.072
0.17%
Ranking of countries by current statistics by years


Comments: