29
/
en
AIzaSyAYiBZKx7MnpbEhh9jyipgxe19OcubqV5w
April 1, 2024
268461
Tunisia
TUN
true
2
1
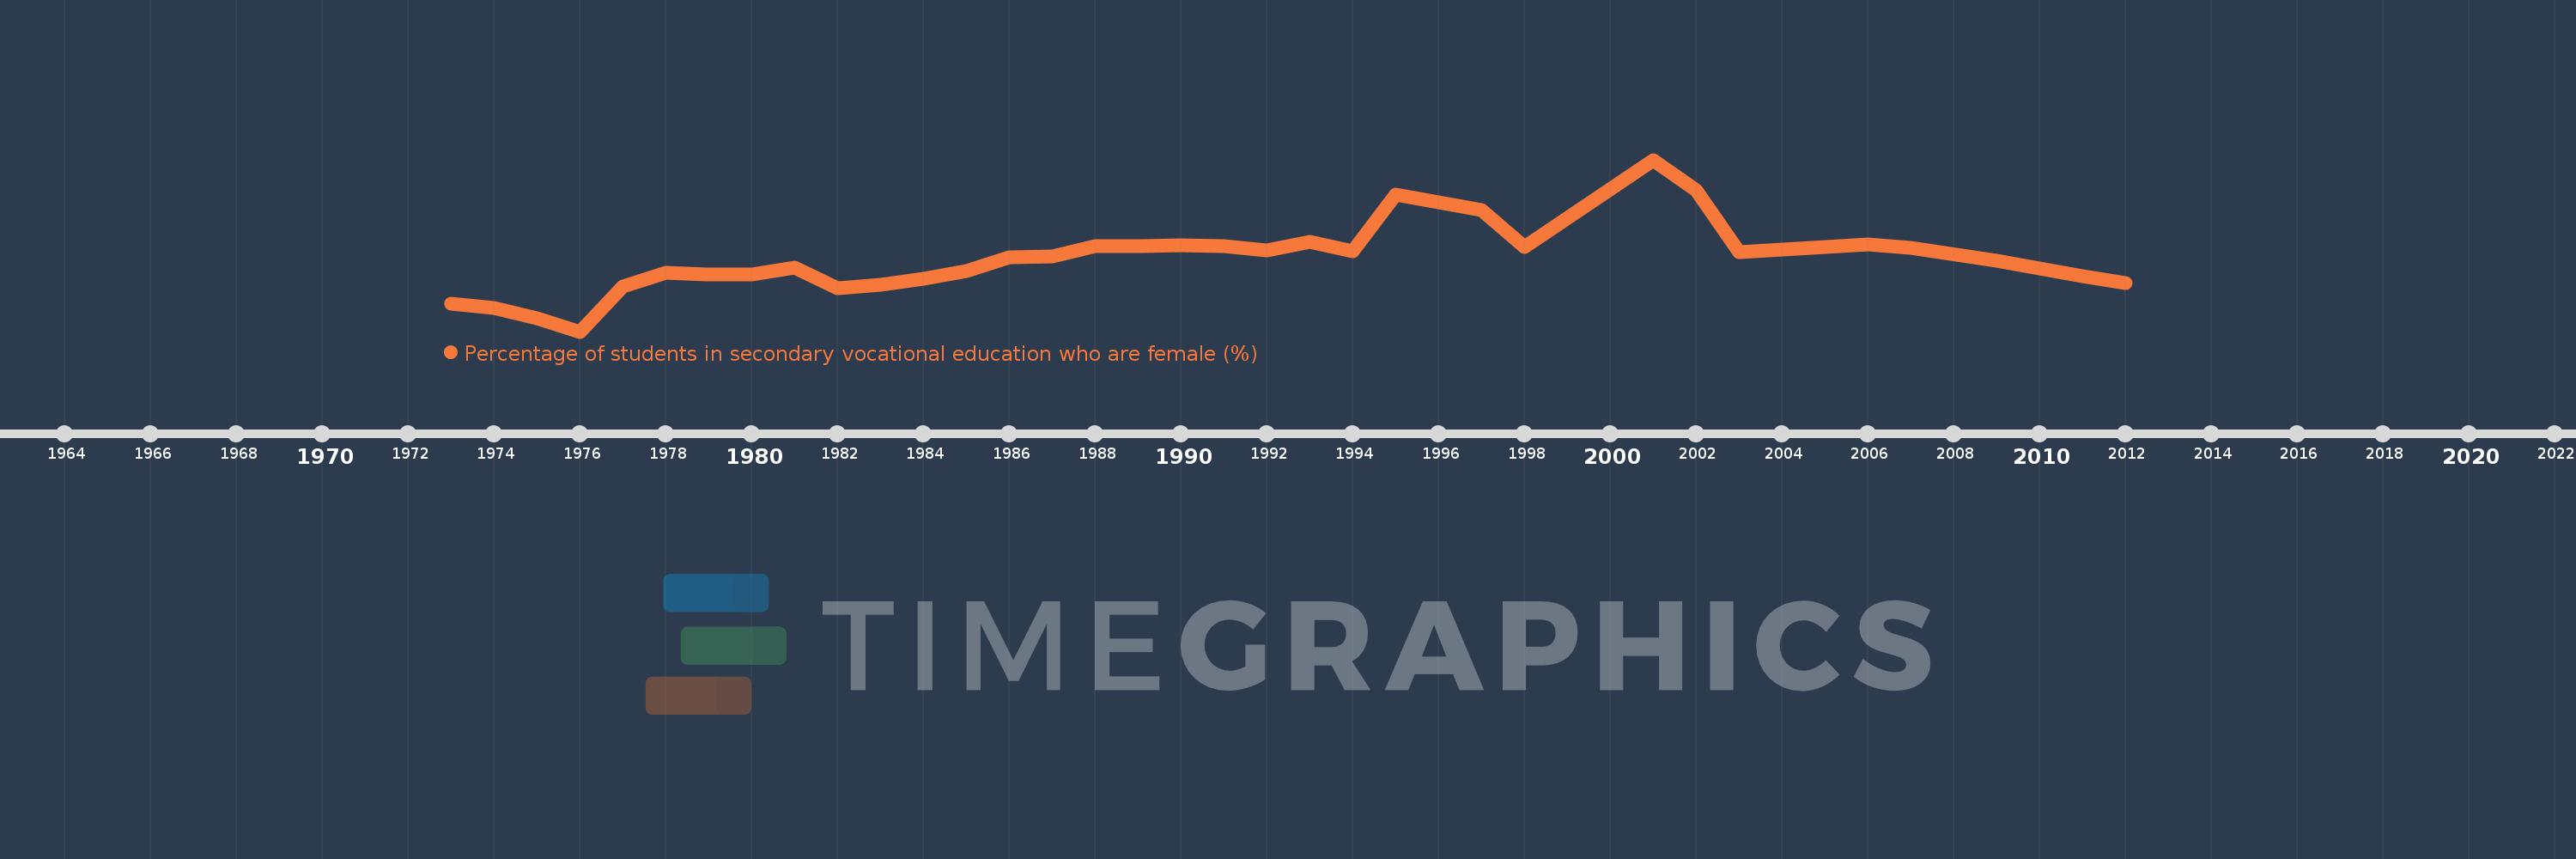
Percentage of students in secondary vocational education who are female (%)
2012,2011,2010,2009,2007,2006,2003,2002,2001,1998,1997,1996,1995,1994,1993,1992,1991,1990,1989,1988,1987,1986,1985,1984,1983,1982,1981,1980,1979,1978,1977,1976,1975,1974,1973
This statistics in other country:
AfghanistanAlbaniaAlgeriaAndorraAngolaAntigua and BarbudaArab WorldArgentinaArmeniaArubaAustraliaAustriaAzerbaijanBahrainBangladeshBarbadosBelarusBelgiumBelizeBeninBermudaBhutanBoliviaBosnia and HerzegovinaBotswanaBrazilBritish Virgin IslandsBrunei DarussalamBulgariaBurkina FasoBurundiCabo VerdeCambodiaCameroonCanadaCaribbean small statesCentral African RepublicCentral Europe and the BalticsChadChileChinaColombiaComorosCongo, Dem. Rep.Congo, Rep.Costa RicaCote d'IvoireCroatiaCubaCuracaoCyprusCzech RepublicDenmarkDjiboutiDominicaDominican RepublicEarly-demographic dividendEast Asia & PacificEast Asia & Pacific (excluding high income)East Asia & Pacific (IDA & IBRD countries)EcuadorEgypt, Arab Rep.El SalvadorEquatorial GuineaEritreaEstoniaEthiopiaEuro areaEurope & Central AsiaEurope & Central Asia (excluding high income)Europe & Central Asia (IDA & IBRD countries)European UnionFijiFinlandFragile and conflict affected situationsFranceGabonGambia, TheGeorgiaGermanyGhanaGibraltarGreeceGrenadaGuatemalaGuineaGuinea-BissauGuyanaHaitiHeavily indebted poor countries (HIPC)High incomeHondurasHong Kong SAR, ChinaHungaryIBRD onlyIcelandIDA & IBRD totalIDA blendIDA onlyIDA totalIndiaIndonesiaIran, Islamic Rep.IraqIrelandIsraelItalyJamaicaJapanJordanKazakhstanKenyaKiribatiKorea, Rep.KuwaitKyrgyz RepublicLao PDRLate-demographic dividendLatin America & Caribbean Latin America & Caribbean (excluding high income)Latin America & the Caribbean (IDA & IBRD countries)LatviaLeast developed countries: UN classificationLebanonLesothoLiberiaLibyaLiechtensteinLithuaniaLow & middle incomeLow incomeLower middle incomeLuxembourgMacao SAR, ChinaMacedonia, FYRMadagascarMalawiMalaysiaMaldivesMaliMaltaMarshall IslandsMauritaniaMauritiusMexicoMicronesia, Fed. Sts.Middle East & North AfricaMiddle East & North Africa (excluding high income)Middle East & North Africa (IDA & IBRD countries)Middle incomeMoldovaMonacoMongoliaMontenegroMoroccoMozambiqueMyanmarNamibiaNauruNepalNetherlandsNew ZealandNicaraguaNigerNigeriaNorth AmericaNorwayOECD membersOmanOther small statesPacific island small statesPakistanPanamaPapua New GuineaParaguayPeruPolandPortugalPost-demographic dividendPre-demographic dividendPuerto RicoQatarRomaniaRussian FederationRwandaSamoaSan MarinoSao Tome and PrincipeSaudi ArabiaSenegalSerbiaSeychellesSierra LeoneSingaporeSint Maarten (Dutch part)Slovak RepublicSloveniaSmall statesSolomon IslandsSomaliaSouth AfricaSouth AsiaSouth Asia (IDA & IBRD)SpainSri LankaSt. Kitts and NevisSt. LuciaSt. Vincent and the GrenadinesSub-Saharan Africa Sub-Saharan Africa (excluding high income)Sub-Saharan Africa (IDA & IBRD countries)SudanSurinameSwazilandSwedenSwitzerlandSyrian Arab RepublicTajikistanTanzaniaThailandTimor-LesteTogoTongaTrinidad and TobagoTunisiaTurkeyTurkmenistanTurks and Caicos IslandsTuvaluUgandaUkraineUnited Arab EmiratesUnited KingdomUpper middle incomeUruguayUzbekistanVanuatuVenezuela, RBVietnamWest Bank and GazaWorldYemen, Rep.ZambiaZimbabwe Timeline:
This timeline shows a graph from 1973 to 2012 of Tunisia. No data until 1972. Number of actual observations by date: 35.
Source name:
World Development Indicators
Source organization:
UNESCO Institute for Statistics
Categories, topics:
Education, Gender
Last updated:
apr 23, 2017
Indicators value changes by year
Minimum:
23.573
jan 1, 1976
Maximum:
54.821
jan 1, 2001
At the date of observation
Value
Absolute change
Change from previous value
jan 1, 1973
28.663
+28.663
0.0%
jan 1, 1974
27.829
-0.833
-2.91%
jan 1, 1975
25.973
-1.857
-6.67%
jan 1, 1976
23.573
-2.399
-9.24%
jan 1, 1977
31.704
+8.131
34.49%
jan 1, 1978
34.308
+2.603
8.21%
jan 1, 1979
33.95
-0.358
-1.04%
jan 1, 1980
33.988
+0.038
0.11%
jan 1, 1981
35.253
+1.264
3.72%
jan 1, 1982
31.535
-3.718
-10.55%
jan 1, 1983
32.153
+0.618
1.96%
jan 1, 1984
33.13
+0.977
3.04%
jan 1, 1985
34.565
+1.434
4.33%
jan 1, 1986
37.03
+2.465
7.13%
jan 1, 1987
37.243
+0.213
0.57%
jan 1, 1988
39.084
+1.842
4.95%
jan 1, 1989
39.08
-0.005
-0.01%
jan 1, 1990
39.201
+0.122
0.31%
jan 1, 1991
39.045
-0.156
-0.4%
jan 1, 1992
38.284
-0.761
-1.95%
jan 1, 1993
39.95
+1.665
4.35%
jan 1, 1994
38.163
-1.787
-4.47%
jan 1, 1995
48.454
+10.291
26.97%
jan 1, 1996
47.097
-1.357
-2.8%
jan 1, 1997
45.625
-1.471
-3.12%
jan 1, 1998
39.028
-6.598
-14.46%
jan 1, 2001
54.821
+15.793
40.47%
jan 1, 2002
49.299
-5.522
-10.07%
jan 1, 2003
38.097
-11.202
-22.72%
jan 1, 2006
39.39
+1.293
3.39%
jan 1, 2007
38.736
-0.654
-1.66%
jan 1, 2009
36.467
-2.269
-5.86%
jan 1, 2010
34.984
-1.483
-4.07%
jan 1, 2011
33.686
-1.297
-3.71%
jan 1, 2012
32.465
-1.221
-3.63%
Ranking of countries by current statistics by years


Comments: