29
/
en
AIzaSyAYiBZKx7MnpbEhh9jyipgxe19OcubqV5w
April 1, 2024
81645
Belgium
BEL
true
2
1
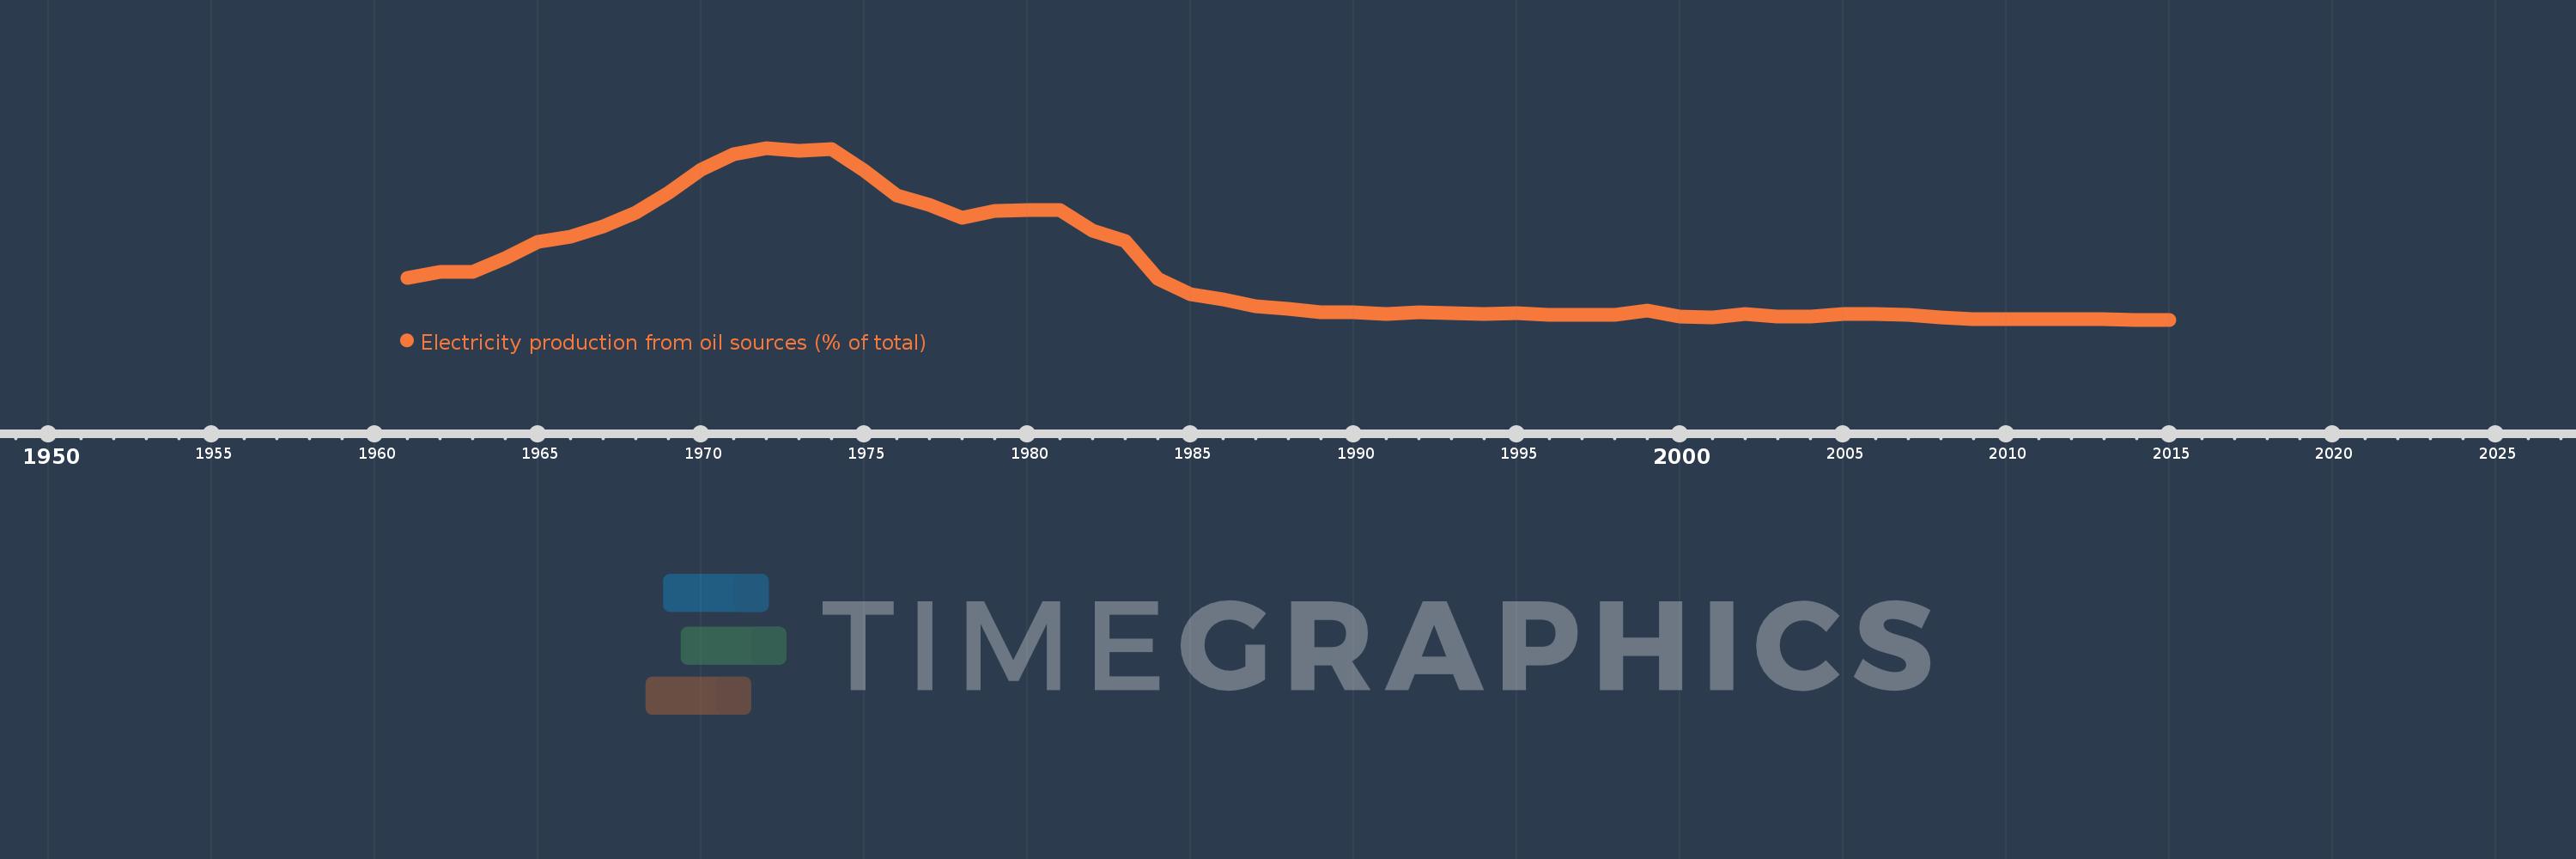
Electricity production from oil sources (% of total)
2015,2014,2013,2012,2011,2010,2009,2008,2007,2006,2005,2004,2003,2002,2001,2000,1999,1998,1997,1996,1995,1994,1993,1992,1991,1990,1989,1988,1987,1986,1985,1984,1983,1982,1981,1980,1979,1978,1977,1976,1975,1974,1973,1972,1971,1970,1969,1968,1967,1966,1965,1964,1963,1962,1961
This statistics in other country:
AlbaniaAlgeriaAngolaArab WorldArgentinaArmeniaAustraliaAustriaAzerbaijanBahrainBangladeshBelarusBelgiumBeninBoliviaBosnia and HerzegovinaBotswanaBrazilBrunei DarussalamBulgariaCambodiaCameroonCanadaCentral Europe and the BalticsChileChinaColombiaCongo, Dem. Rep.Congo, Rep.Costa RicaCote d'IvoireCroatiaCubaCuracaoCyprusCzech RepublicDenmarkDominican RepublicEarly-demographic dividendEast Asia & PacificEast Asia & Pacific (excluding high income)East Asia & Pacific (IDA & IBRD countries)EcuadorEgypt, Arab Rep.El SalvadorEritreaEstoniaEthiopiaEuro areaEurope & Central AsiaEurope & Central Asia (excluding high income)Europe & Central Asia (IDA & IBRD countries)European UnionFinlandFragile and conflict affected situationsFranceGabonGeorgiaGermanyGhanaGibraltarGreeceGuatemalaHaitiHeavily indebted poor countries (HIPC)High incomeHondurasHong Kong SAR, ChinaHungaryIBRD onlyIcelandIDA & IBRD totalIDA blendIDA onlyIDA totalIndiaIndonesiaIran, Islamic Rep.IraqIrelandIsraelItalyJamaicaJapanJordanKazakhstanKenyaKorea, Dem. People’s Rep.Korea, Rep.KosovoKuwaitKyrgyz RepublicLate-demographic dividendLatin America & Caribbean Latin America & Caribbean (excluding high income)Latin America & the Caribbean (IDA & IBRD countries)LatviaLeast developed countries: UN classificationLebanonLibyaLithuaniaLow & middle incomeLower middle incomeLuxembourgMacedonia, FYRMalaysiaMaltaMauritiusMexicoMiddle East & North AfricaMiddle East & North Africa (excluding high income)Middle East & North Africa (IDA & IBRD countries)Middle incomeMoldovaMongoliaMontenegroMoroccoMozambiqueMyanmarNamibiaNepalNetherlandsNew ZealandNicaraguaNigerNigeriaNorth AmericaNorwayOECD membersOmanOther small statesPakistanPanamaParaguayPeruPhilippinesPolandPortugalPost-demographic dividendPre-demographic dividendQatarRomaniaRussian FederationSaudi ArabiaSenegalSerbiaSingaporeSlovak RepublicSloveniaSmall statesSouth AfricaSouth AsiaSouth Asia (IDA & IBRD)South SudanSpainSri LankaSub-Saharan Africa Sub-Saharan Africa (excluding high income)Sub-Saharan Africa (IDA & IBRD countries)SudanSwedenSwitzerlandSyrian Arab RepublicTajikistanTanzaniaThailandTogoTrinidad and TobagoTunisiaTurkeyTurkmenistanUkraineUnited Arab EmiratesUnited KingdomUnited StatesUpper middle incomeUruguayUzbekistanVenezuela, RBVietnamWorldYemen, Rep.ZambiaZimbabwe Timeline:
This timeline shows a graph from 1961 to 2015 of Belgium. No data until 1960. Number of actual observations by date: 55.
Source name:
World Development Indicators
Source organization:
IEA Statistics © OECD/IEA 2014 (http://www.iea.org/stats/index.asp), subject to https://www.iea.org/t&c/termsandconditions/
Categories, topics:
Energy & Mining, Climate Change, Infrastructure
Last updated:
apr 23, 2017
Indicators value changes by year
Maximum:
54.135
jan 1, 1972
At the date of observation
Value
Absolute change
Change from previous value
jan 1, 1961
13.233
+13.233
0.0%
jan 1, 1962
15.235
+2.002
15.13%
jan 1, 1963
15.281
+0.046
0.3%
jan 1, 1964
19.631
+4.35
28.47%
jan 1, 1965
24.753
+5.122
26.09%
jan 1, 1966
26.212
+1.459
5.89%
jan 1, 1967
29.433
+3.221
12.29%
jan 1, 1968
33.899
+4.466
15.17%
jan 1, 1969
40.083
+6.184
18.24%
jan 1, 1970
47.307
+7.224
18.02%
jan 1, 1971
52.082
+4.775
10.09%
jan 1, 1972
54.135
+2.053
3.94%
jan 1, 1973
53.162
-0.973
-1.8%
jan 1, 1974
53.724
+0.562
1.06%
jan 1, 1975
46.973
-6.751
-12.57%
jan 1, 1976
39.291
-7.681
-16.35%
jan 1, 1977
36.286
-3.006
-7.65%
jan 1, 1978
32.119
-4.167
-11.48%
jan 1, 1979
34.471
+2.351
7.32%
jan 1, 1980
34.737
+0.266
0.77%
jan 1, 1981
34.671
-0.066
-0.19%
jan 1, 1982
28.291
-6.38
-18.4%
jan 1, 1983
25.057
-3.234
-11.43%
jan 1, 1984
13.187
-11.87
-47.37%
jan 1, 1985
8.244
-4.943
-37.49%
jan 1, 1986
6.651
-1.592
-19.31%
jan 1, 1987
4.337
-2.314
-34.8%
jan 1, 1988
3.592
-0.745
-17.17%
jan 1, 1989
2.66
-0.932
-25.94%
jan 1, 1990
2.546
-0.114
-4.28%
jan 1, 1991
1.869
-0.677
-26.59%
jan 1, 1992
2.565
+0.696
37.22%
jan 1, 1993
2.161
-0.404
-15.76%
jan 1, 1994
2.105
-0.056
-2.58%
jan 1, 1995
2.268
+0.163
7.74%
jan 1, 1996
1.786
-0.482
-21.25%
jan 1, 1997
1.717
-0.069
-3.87%
jan 1, 1998
1.826
+0.109
6.38%
jan 1, 1999
3.143
+1.317
72.12%
jan 1, 2000
1.242
-1.902
-60.5%
jan 1, 2001
0.963
-0.279
-22.44%
jan 1, 2002
2.117
+1.154
119.82%
jan 1, 2003
1.201
-0.916
-43.26%
jan 1, 2004
1.205
+0.004
0.35%
jan 1, 2005
1.987
+0.782
64.87%
jan 1, 2006
2.03
+0.043
2.18%
jan 1, 2007
1.633
-0.398
-19.59%
jan 1, 2008
0.929
-0.704
-43.1%
jan 1, 2009
0.486
-0.443
-47.71%
jan 1, 2010
0.312
-0.174
-35.81%
jan 1, 2011
0.433
+0.121
38.86%
jan 1, 2012
0.326
-0.107
-24.75%
jan 1, 2013
0.407
+0.081
24.97%
jan 1, 2014
0.191
-0.216
-53.04%
jan 1, 2015
0.217
+0.026
13.73%
Ranking of countries by current statistics by years


Comments: