29
/
en
AIzaSyAYiBZKx7MnpbEhh9jyipgxe19OcubqV5w
April 1, 2024
214208
Norway
NOR
true
2
1
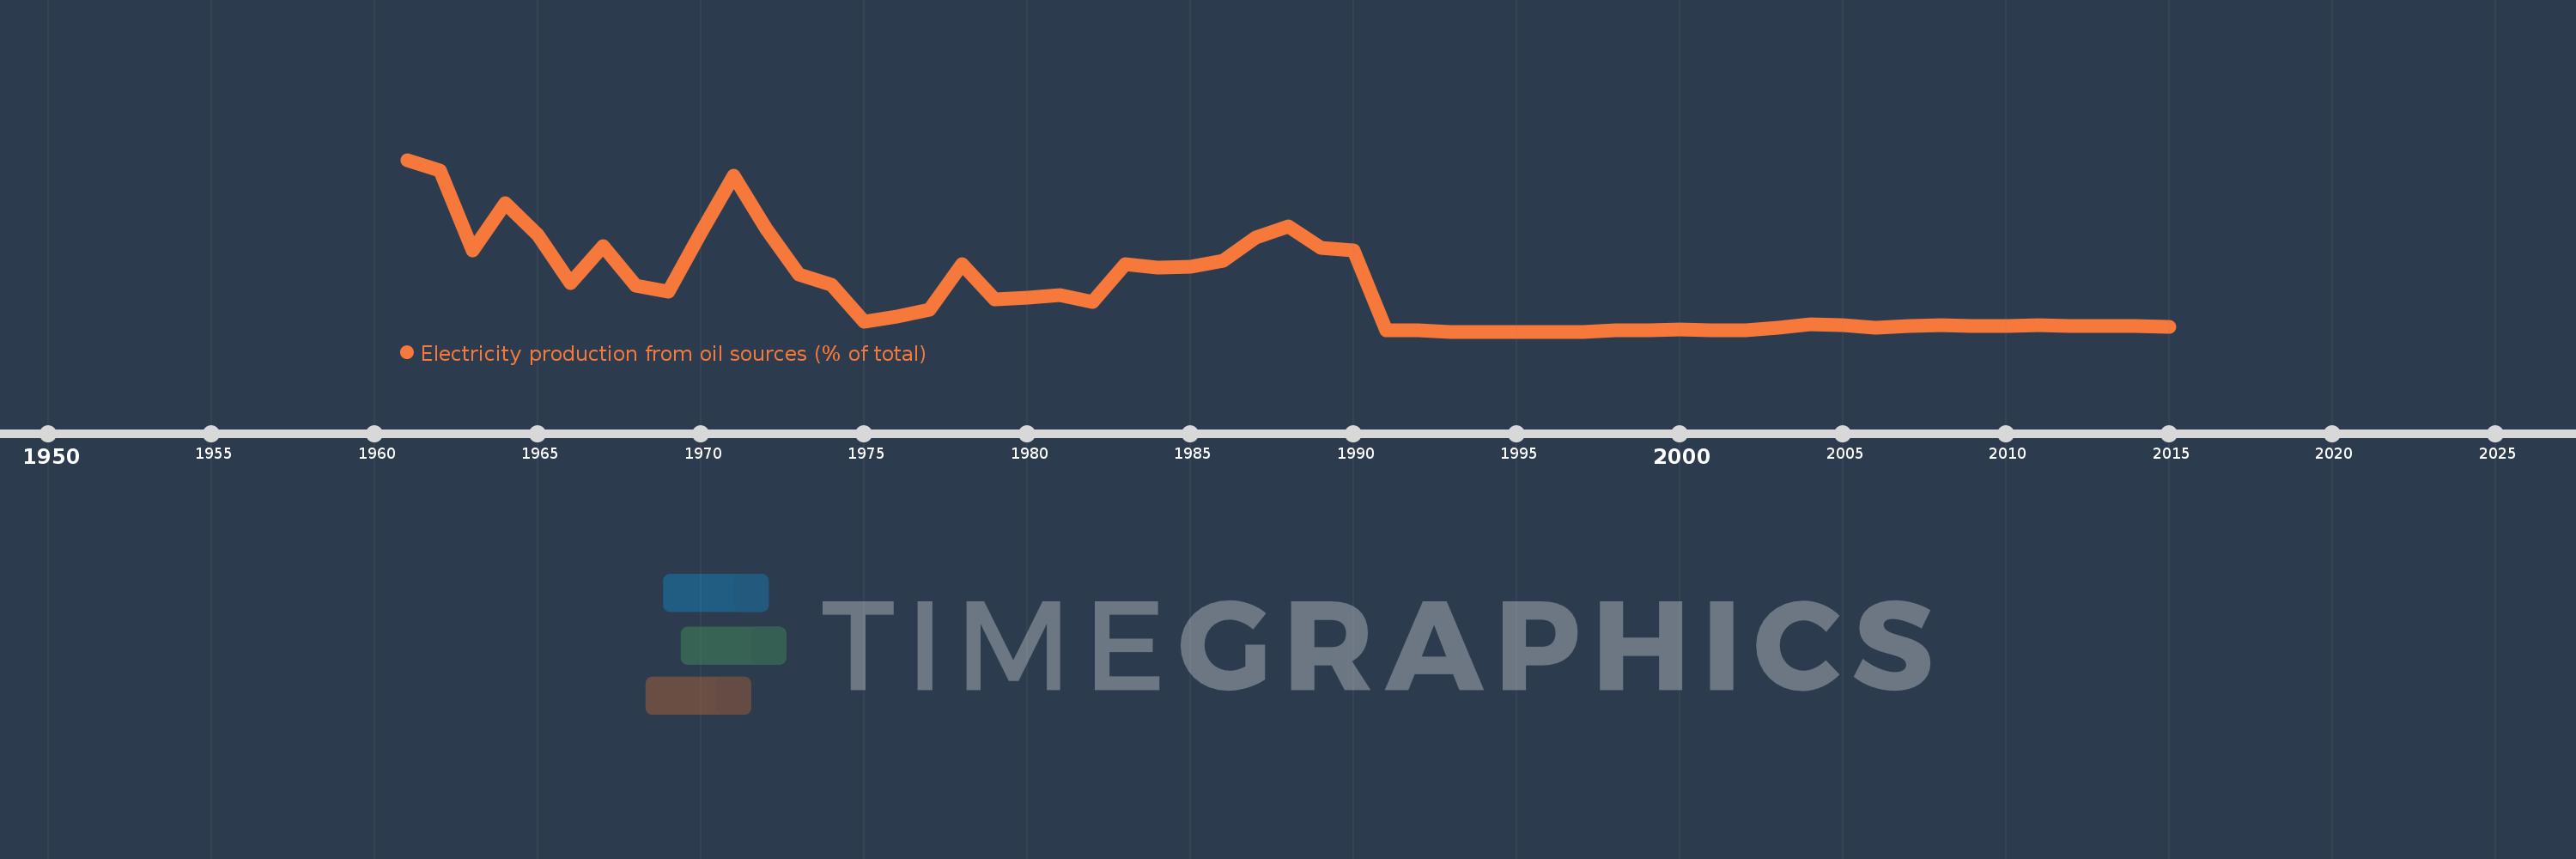
Electricity production from oil sources (% of total)
2015,2014,2013,2012,2011,2010,2009,2008,2007,2006,2005,2004,2003,2002,2001,2000,1999,1998,1997,1996,1995,1994,1993,1992,1991,1990,1989,1988,1987,1986,1985,1984,1983,1982,1981,1980,1979,1978,1977,1976,1975,1974,1973,1972,1971,1970,1969,1968,1967,1966,1965,1964,1963,1962,1961
This statistics in other country:
AlbaniaAlgeriaAngolaArab WorldArgentinaArmeniaAustraliaAustriaAzerbaijanBahrainBangladeshBelarusBelgiumBeninBoliviaBosnia and HerzegovinaBotswanaBrazilBrunei DarussalamBulgariaCambodiaCameroonCanadaCentral Europe and the BalticsChileChinaColombiaCongo, Dem. Rep.Congo, Rep.Costa RicaCote d'IvoireCroatiaCubaCuracaoCyprusCzech RepublicDenmarkDominican RepublicEarly-demographic dividendEast Asia & PacificEast Asia & Pacific (excluding high income)East Asia & Pacific (IDA & IBRD countries)EcuadorEgypt, Arab Rep.El SalvadorEritreaEstoniaEthiopiaEuro areaEurope & Central AsiaEurope & Central Asia (excluding high income)Europe & Central Asia (IDA & IBRD countries)European UnionFinlandFragile and conflict affected situationsFranceGabonGeorgiaGermanyGhanaGibraltarGreeceGuatemalaHaitiHeavily indebted poor countries (HIPC)High incomeHondurasHong Kong SAR, ChinaHungaryIBRD onlyIcelandIDA & IBRD totalIDA blendIDA onlyIDA totalIndiaIndonesiaIran, Islamic Rep.IraqIrelandIsraelItalyJamaicaJapanJordanKazakhstanKenyaKorea, Dem. People’s Rep.Korea, Rep.KosovoKuwaitKyrgyz RepublicLate-demographic dividendLatin America & Caribbean Latin America & Caribbean (excluding high income)Latin America & the Caribbean (IDA & IBRD countries)LatviaLeast developed countries: UN classificationLebanonLibyaLithuaniaLow & middle incomeLower middle incomeLuxembourgMacedonia, FYRMalaysiaMaltaMauritiusMexicoMiddle East & North AfricaMiddle East & North Africa (excluding high income)Middle East & North Africa (IDA & IBRD countries)Middle incomeMoldovaMongoliaMontenegroMoroccoMozambiqueMyanmarNamibiaNepalNetherlandsNew ZealandNicaraguaNigerNigeriaNorth AmericaNorwayOECD membersOmanOther small statesPakistanPanamaParaguayPeruPhilippinesPolandPortugalPost-demographic dividendPre-demographic dividendQatarRomaniaRussian FederationSaudi ArabiaSenegalSerbiaSingaporeSlovak RepublicSloveniaSmall statesSouth AfricaSouth AsiaSouth Asia (IDA & IBRD)South SudanSpainSri LankaSub-Saharan Africa Sub-Saharan Africa (excluding high income)Sub-Saharan Africa (IDA & IBRD countries)SudanSwedenSwitzerlandSyrian Arab RepublicTajikistanTanzaniaThailandTogoTrinidad and TobagoTunisiaTurkeyTurkmenistanUkraineUnited Arab EmiratesUnited KingdomUnited StatesUpper middle incomeUruguayUzbekistanVenezuela, RBVietnamWorldYemen, Rep.ZambiaZimbabwe Timeline:
This timeline shows a graph from 1961 to 2015 of Norway. No data until 1960. Number of actual observations by date: 55.
Source name:
World Development Indicators
Source organization:
IEA Statistics © OECD/IEA 2014 (http://www.iea.org/stats/index.asp), subject to https://www.iea.org/t&c/termsandconditions/
Categories, topics:
Energy & Mining, Climate Change, Infrastructure
Last updated:
apr 23, 2017
Indicators value changes by year
At the date of observation
Value
Absolute change
Change from previous value
jan 1, 1962
0.657
-0.043
-6.1%
jan 1, 1963
0.33
-0.327
-49.7%
jan 1, 1964
0.525
+0.195
58.99%
jan 1, 1965
0.393
-0.132
-25.11%
jan 1, 1966
0.198
-0.196
-49.73%
jan 1, 1967
0.348
+0.15
75.72%
jan 1, 1968
0.189
-0.158
-45.58%
jan 1, 1969
0.163
-0.027
-14.07%
jan 1, 1970
0.404
+0.242
148.89%
jan 1, 1971
0.634
+0.23
56.81%
jan 1, 1972
0.42
-0.214
-33.74%
jan 1, 1973
0.232
-0.188
-44.73%
jan 1, 1974
0.192
-0.041
-17.47%
jan 1, 1975
0.04
-0.151
-78.9%
jan 1, 1976
0.063
+0.023
56.54%
jan 1, 1977
0.089
+0.026
40.57%
jan 1, 1978
0.275
+0.186
209.5%
jan 1, 1979
0.132
-0.143
-51.94%
jan 1, 1980
0.14
+0.007
5.45%
jan 1, 1981
0.148
+0.008
6.08%
jan 1, 1982
0.122
-0.027
-17.9%
jan 1, 1983
0.274
+0.152
125.25%
jan 1, 1984
0.261
-0.013
-4.57%
jan 1, 1985
0.264
+0.002
0.87%
jan 1, 1986
0.29
+0.027
10.06%
jan 1, 1987
0.384
+0.094
32.31%
jan 1, 1988
0.43
+0.046
11.95%
jan 1, 1989
0.341
-0.088
-20.6%
jan 1, 1990
0.331
-0.011
-3.12%
jan 1, 1991
0.005
-0.326
-98.51%
jan 1, 1992
0.006
+0.001
28.32%
jan 1, 1993
0.0
-0.006
-100.0%
jan 1, 1998
0.007
+0.007
%
jan 1, 1999
0.006
-0.001
-16.96%
jan 1, 2000
0.008
+0.002
36.02%
jan 1, 2001
0.006
-0.002
-22.77%
jan 1, 2002
0.007
+0.001
17.46%
jan 1, 2003
0.017
+0.009
127.72%
jan 1, 2004
0.029
+0.012
72.05%
jan 1, 2005
0.025
-0.004
-12.5%
jan 1, 2006
0.017
-0.009
-34.1%
jan 1, 2007
0.024
+0.007
42.75%
jan 1, 2008
0.026
+0.002
7.49%
jan 1, 2009
0.023
-0.002
-9.11%
jan 1, 2010
0.023
0.0
-2.0%
jan 1, 2011
0.025
+0.002
9.82%
jan 1, 2012
0.024
-0.001
-5.62%
jan 1, 2013
0.024
+0.0
0.54%
jan 1, 2014
0.023
-0.001
-2.85%
jan 1, 2015
0.02
-0.003
-14.72%
Ranking of countries by current statistics by years


Comments: