29
/
en
AIzaSyAYiBZKx7MnpbEhh9jyipgxe19OcubqV5w
April 1, 2024
224737
Poland
POL
true
2
1
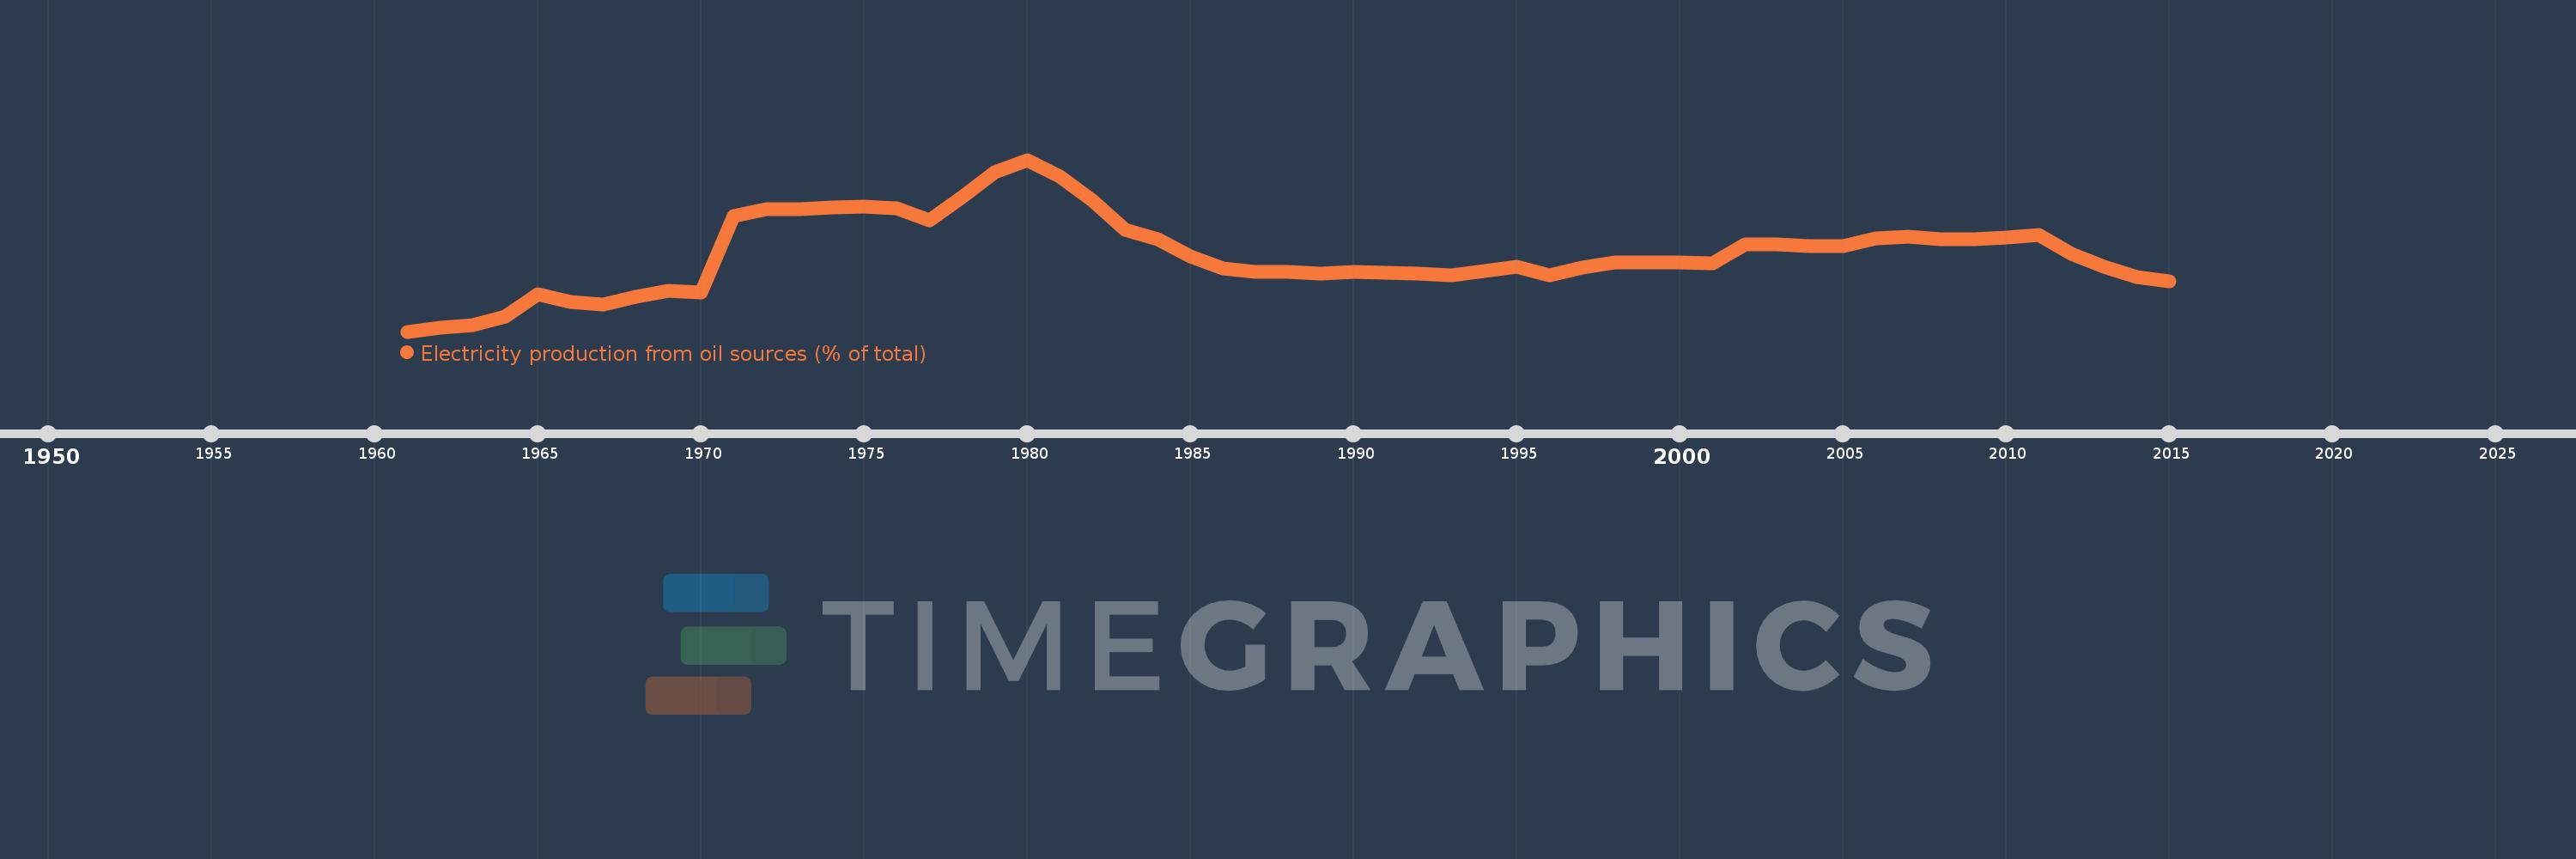
Electricity production from oil sources (% of total)
2015,2014,2013,2012,2011,2010,2009,2008,2007,2006,2005,2004,2003,2002,2001,2000,1999,1998,1997,1996,1995,1994,1993,1992,1991,1990,1989,1988,1987,1986,1985,1984,1983,1982,1981,1980,1979,1978,1977,1976,1975,1974,1973,1972,1971,1970,1969,1968,1967,1966,1965,1964,1963,1962,1961
This statistics in other country:
AlbaniaAlgeriaAngolaArab WorldArgentinaArmeniaAustraliaAustriaAzerbaijanBahrainBangladeshBelarusBelgiumBeninBoliviaBosnia and HerzegovinaBotswanaBrazilBrunei DarussalamBulgariaCambodiaCameroonCanadaCentral Europe and the BalticsChileChinaColombiaCongo, Dem. Rep.Congo, Rep.Costa RicaCote d'IvoireCroatiaCubaCuracaoCyprusCzech RepublicDenmarkDominican RepublicEarly-demographic dividendEast Asia & PacificEast Asia & Pacific (excluding high income)East Asia & Pacific (IDA & IBRD countries)EcuadorEgypt, Arab Rep.El SalvadorEritreaEstoniaEthiopiaEuro areaEurope & Central AsiaEurope & Central Asia (excluding high income)Europe & Central Asia (IDA & IBRD countries)European UnionFinlandFragile and conflict affected situationsFranceGabonGeorgiaGermanyGhanaGibraltarGreeceGuatemalaHaitiHeavily indebted poor countries (HIPC)High incomeHondurasHong Kong SAR, ChinaHungaryIBRD onlyIcelandIDA & IBRD totalIDA blendIDA onlyIDA totalIndiaIndonesiaIran, Islamic Rep.IraqIrelandIsraelItalyJamaicaJapanJordanKazakhstanKenyaKorea, Dem. People’s Rep.Korea, Rep.KosovoKuwaitKyrgyz RepublicLate-demographic dividendLatin America & Caribbean Latin America & Caribbean (excluding high income)Latin America & the Caribbean (IDA & IBRD countries)LatviaLeast developed countries: UN classificationLebanonLibyaLithuaniaLow & middle incomeLower middle incomeLuxembourgMacedonia, FYRMalaysiaMaltaMauritiusMexicoMiddle East & North AfricaMiddle East & North Africa (excluding high income)Middle East & North Africa (IDA & IBRD countries)Middle incomeMoldovaMongoliaMontenegroMoroccoMozambiqueMyanmarNamibiaNepalNetherlandsNew ZealandNicaraguaNigerNigeriaNorth AmericaNorwayOECD membersOmanOther small statesPakistanPanamaParaguayPeruPhilippinesPolandPortugalPost-demographic dividendPre-demographic dividendQatarRomaniaRussian FederationSaudi ArabiaSenegalSerbiaSingaporeSlovak RepublicSloveniaSmall statesSouth AfricaSouth AsiaSouth Asia (IDA & IBRD)South SudanSpainSri LankaSub-Saharan Africa Sub-Saharan Africa (excluding high income)Sub-Saharan Africa (IDA & IBRD countries)SudanSwedenSwitzerlandSyrian Arab RepublicTajikistanTanzaniaThailandTogoTrinidad and TobagoTunisiaTurkeyTurkmenistanUkraineUnited Arab EmiratesUnited KingdomUnited StatesUpper middle incomeUruguayUzbekistanVenezuela, RBVietnamWorldYemen, Rep.ZambiaZimbabwe Timeline:
This timeline shows a graph from 1961 to 2015 of Poland. No data until 1960. Number of actual observations by date: 55.
Source name:
World Development Indicators
Source organization:
IEA Statistics © OECD/IEA 2014 (http://www.iea.org/stats/index.asp), subject to https://www.iea.org/t&c/termsandconditions/
Categories, topics:
Energy & Mining, Climate Change, Infrastructure
Last updated:
apr 23, 2017
Indicators value changes by year
At the date of observation
Value
Absolute change
Change from previous value
jan 1, 1961
0.106
+0.106
0.0%
jan 1, 1962
0.171
+0.065
61.14%
jan 1, 1963
0.226
+0.056
32.61%
jan 1, 1964
0.382
+0.155
68.73%
jan 1, 1965
0.774
+0.392
102.67%
jan 1, 1966
0.633
-0.141
-18.22%
jan 1, 1967
0.598
-0.035
-5.53%
jan 1, 1968
0.73
+0.133
22.18%
jan 1, 1969
0.833
+0.103
14.07%
jan 1, 1970
0.812
-0.021
-2.47%
jan 1, 1971
2.187
+1.375
169.29%
jan 1, 1972
2.302
+0.115
5.26%
jan 1, 1973
2.304
+0.002
0.07%
jan 1, 1974
2.337
+0.033
1.44%
jan 1, 1975
2.358
+0.021
0.89%
jan 1, 1976
2.322
-0.036
-1.53%
jan 1, 1977
2.099
-0.222
-9.57%
jan 1, 1978
2.515
+0.415
19.78%
jan 1, 1979
2.967
+0.453
18.0%
jan 1, 1980
3.193
+0.226
7.61%
jan 1, 1981
2.887
-0.306
-9.57%
jan 1, 1982
2.467
-0.421
-14.58%
jan 1, 1983
1.932
-0.534
-21.66%
jan 1, 1984
1.763
-0.169
-8.75%
jan 1, 1985
1.454
-0.309
-17.52%
jan 1, 1986
1.238
-0.216
-14.85%
jan 1, 1987
1.175
-0.064
-5.13%
jan 1, 1988
1.184
+0.009
0.76%
jan 1, 1989
1.145
-0.038
-3.24%
jan 1, 1990
1.18
+0.035
3.01%
jan 1, 1991
1.168
-0.012
-1.01%
jan 1, 1992
1.151
-0.017
-1.44%
jan 1, 1993
1.115
-0.036
-3.16%
jan 1, 1994
1.193
+0.078
7.0%
jan 1, 1995
1.265
+0.072
6.03%
jan 1, 1996
1.111
-0.154
-12.14%
jan 1, 1997
1.255
+0.144
12.93%
jan 1, 1998
1.349
+0.094
7.48%
jan 1, 1999
1.351
+0.002
0.17%
jan 1, 2000
1.351
0.0
-0.03%
jan 1, 2001
1.338
-0.012
-0.92%
jan 1, 2002
1.669
+0.33
24.68%
jan 1, 2003
1.667
-0.001
-0.07%
jan 1, 2004
1.637
-0.03
-1.81%
jan 1, 2005
1.643
+0.006
0.38%
jan 1, 2006
1.775
+0.131
7.98%
jan 1, 2007
1.809
+0.035
1.97%
jan 1, 2008
1.76
-0.05
-2.74%
jan 1, 2009
1.762
+0.002
0.12%
jan 1, 2010
1.802
+0.04
2.26%
jan 1, 2011
1.841
+0.039
2.17%
jan 1, 2012
1.504
-0.337
-18.31%
jan 1, 2013
1.265
-0.239
-15.91%
jan 1, 2014
1.087
-0.178
-14.08%
jan 1, 2015
1.007
-0.08
-7.36%
Ranking of countries by current statistics by years


Comments: