29
/
en
AIzaSyAYiBZKx7MnpbEhh9jyipgxe19OcubqV5w
April 1, 2024
44994
Low & middle income
LMY
false
2
1
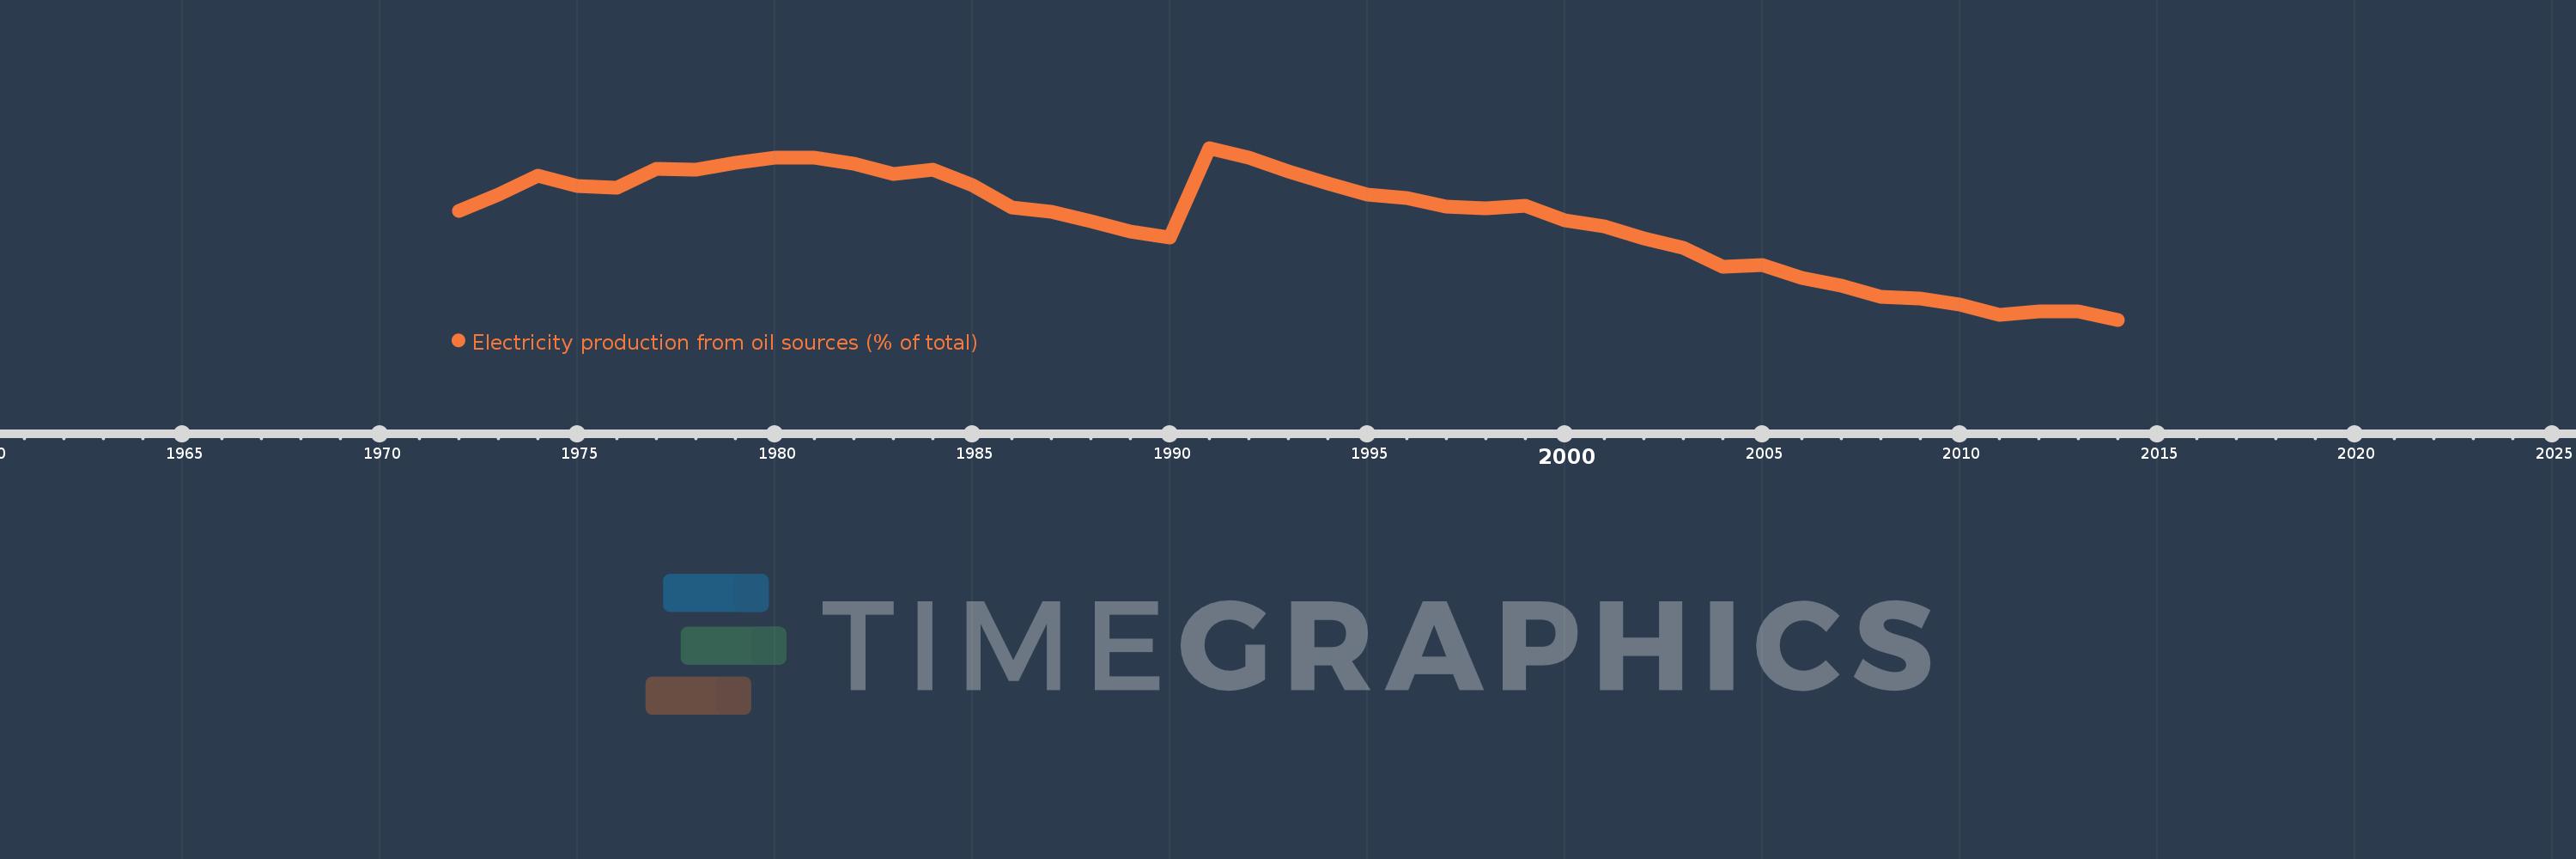
Electricity production from oil sources (% of total)
2014,2013,2012,2011,2010,2009,2008,2007,2006,2005,2004,2003,2002,2001,2000,1999,1998,1997,1996,1995,1994,1993,1992,1991,1990,1989,1988,1987,1986,1985,1984,1983,1982,1981,1980,1979,1978,1977,1976,1975,1974,1973,1972
This statistics in other country:
AlbaniaAlgeriaAngolaArab WorldArgentinaArmeniaAustraliaAustriaAzerbaijanBahrainBangladeshBelarusBelgiumBeninBoliviaBosnia and HerzegovinaBotswanaBrazilBrunei DarussalamBulgariaCambodiaCameroonCanadaCentral Europe and the BalticsChileChinaColombiaCongo, Dem. Rep.Congo, Rep.Costa RicaCote d'IvoireCroatiaCubaCuracaoCyprusCzech RepublicDenmarkDominican RepublicEarly-demographic dividendEast Asia & PacificEast Asia & Pacific (excluding high income)East Asia & Pacific (IDA & IBRD countries)EcuadorEgypt, Arab Rep.El SalvadorEritreaEstoniaEthiopiaEuro areaEurope & Central AsiaEurope & Central Asia (excluding high income)Europe & Central Asia (IDA & IBRD countries)European UnionFinlandFragile and conflict affected situationsFranceGabonGeorgiaGermanyGhanaGibraltarGreeceGuatemalaHaitiHeavily indebted poor countries (HIPC)High incomeHondurasHong Kong SAR, ChinaHungaryIBRD onlyIcelandIDA & IBRD totalIDA blendIDA onlyIDA totalIndiaIndonesiaIran, Islamic Rep.IraqIrelandIsraelItalyJamaicaJapanJordanKazakhstanKenyaKorea, Dem. People’s Rep.Korea, Rep.KosovoKuwaitKyrgyz RepublicLate-demographic dividendLatin America & Caribbean Latin America & Caribbean (excluding high income)Latin America & the Caribbean (IDA & IBRD countries)LatviaLeast developed countries: UN classificationLebanonLibyaLithuaniaLow & middle incomeLower middle incomeLuxembourgMacedonia, FYRMalaysiaMaltaMauritiusMexicoMiddle East & North AfricaMiddle East & North Africa (excluding high income)Middle East & North Africa (IDA & IBRD countries)Middle incomeMoldovaMongoliaMontenegroMoroccoMozambiqueMyanmarNamibiaNepalNetherlandsNew ZealandNicaraguaNigerNigeriaNorth AmericaNorwayOECD membersOmanOther small statesPakistanPanamaParaguayPeruPhilippinesPolandPortugalPost-demographic dividendPre-demographic dividendQatarRomaniaRussian FederationSaudi ArabiaSenegalSerbiaSingaporeSlovak RepublicSloveniaSmall statesSouth AfricaSouth AsiaSouth Asia (IDA & IBRD)South SudanSpainSri LankaSub-Saharan Africa Sub-Saharan Africa (excluding high income)Sub-Saharan Africa (IDA & IBRD countries)SudanSwedenSwitzerlandSyrian Arab RepublicTajikistanTanzaniaThailandTogoTrinidad and TobagoTunisiaTurkeyTurkmenistanUkraineUnited Arab EmiratesUnited KingdomUnited StatesUpper middle incomeUruguayUzbekistanVenezuela, RBVietnamWorldYemen, Rep.ZambiaZimbabwe Timeline:
This timeline shows a graph from 1972 to 2014 of Low & middle income. No data until 1971. Number of actual observations by date: 43.
Source name:
World Development Indicators
Source organization:
IEA Statistics © OECD/IEA 2014 (http://www.iea.org/stats/index.asp), subject to https://www.iea.org/t&c/termsandconditions/
Categories, topics:
Energy & Mining, Climate Change, Infrastructure
Last updated:
apr 23, 2017
Indicators value changes by year
Maximum:
13.879
jan 1, 1991
At the date of observation
Value
Absolute change
Change from previous value
jan 1, 1972
10.22
+10.22
0.0%
jan 1, 1973
11.203
+0.982
9.61%
jan 1, 1974
12.293
+1.09
9.73%
jan 1, 1975
11.674
-0.619
-5.04%
jan 1, 1976
11.568
-0.106
-0.91%
jan 1, 1977
12.673
+1.105
9.55%
jan 1, 1978
12.631
-0.042
-0.33%
jan 1, 1979
13.014
+0.383
3.03%
jan 1, 1980
13.306
+0.292
2.25%
jan 1, 1981
13.321
+0.015
0.11%
jan 1, 1982
12.955
-0.366
-2.75%
jan 1, 1983
12.35
-0.605
-4.67%
jan 1, 1984
12.622
+0.272
2.2%
jan 1, 1985
11.747
-0.875
-6.93%
jan 1, 1986
10.428
-1.319
-11.23%
jan 1, 1987
10.207
-0.221
-2.12%
jan 1, 1988
9.652
-0.555
-5.43%
jan 1, 1989
9.065
-0.587
-6.09%
jan 1, 1990
8.685
-0.38
-4.19%
jan 1, 1991
13.879
+5.194
59.8%
jan 1, 1992
13.322
-0.557
-4.01%
jan 1, 1993
12.513
-0.809
-6.07%
jan 1, 1994
11.811
-0.702
-5.61%
jan 1, 1995
11.167
-0.644
-5.46%
jan 1, 1996
10.972
-0.195
-1.74%
jan 1, 1997
10.466
-0.506
-4.61%
jan 1, 1998
10.388
-0.079
-0.75%
jan 1, 1999
10.547
+0.159
1.53%
jan 1, 2000
9.713
-0.834
-7.9%
jan 1, 2001
9.345
-0.368
-3.79%
jan 1, 2002
8.65
-0.695
-7.44%
jan 1, 2003
8.09
-0.56
-6.47%
jan 1, 2004
7.02
-1.071
-13.23%
jan 1, 2005
7.131
+0.112
1.59%
jan 1, 2006
6.357
-0.774
-10.86%
jan 1, 2007
5.908
-0.449
-7.06%
jan 1, 2008
5.29
-0.618
-10.46%
jan 1, 2009
5.172
-0.118
-2.24%
jan 1, 2010
4.833
-0.339
-6.56%
jan 1, 2011
4.25
-0.583
-12.06%
jan 1, 2012
4.426
+0.176
4.14%
jan 1, 2013
4.412
-0.014
-0.32%
jan 1, 2014
3.95
-0.462
-10.46%
Ranking of countries by current statistics by years


Comments: