29
/
en
AIzaSyAYiBZKx7MnpbEhh9jyipgxe19OcubqV5w
April 1, 2024
157169
Iran, Islamic Rep.
IRN
true
2
1
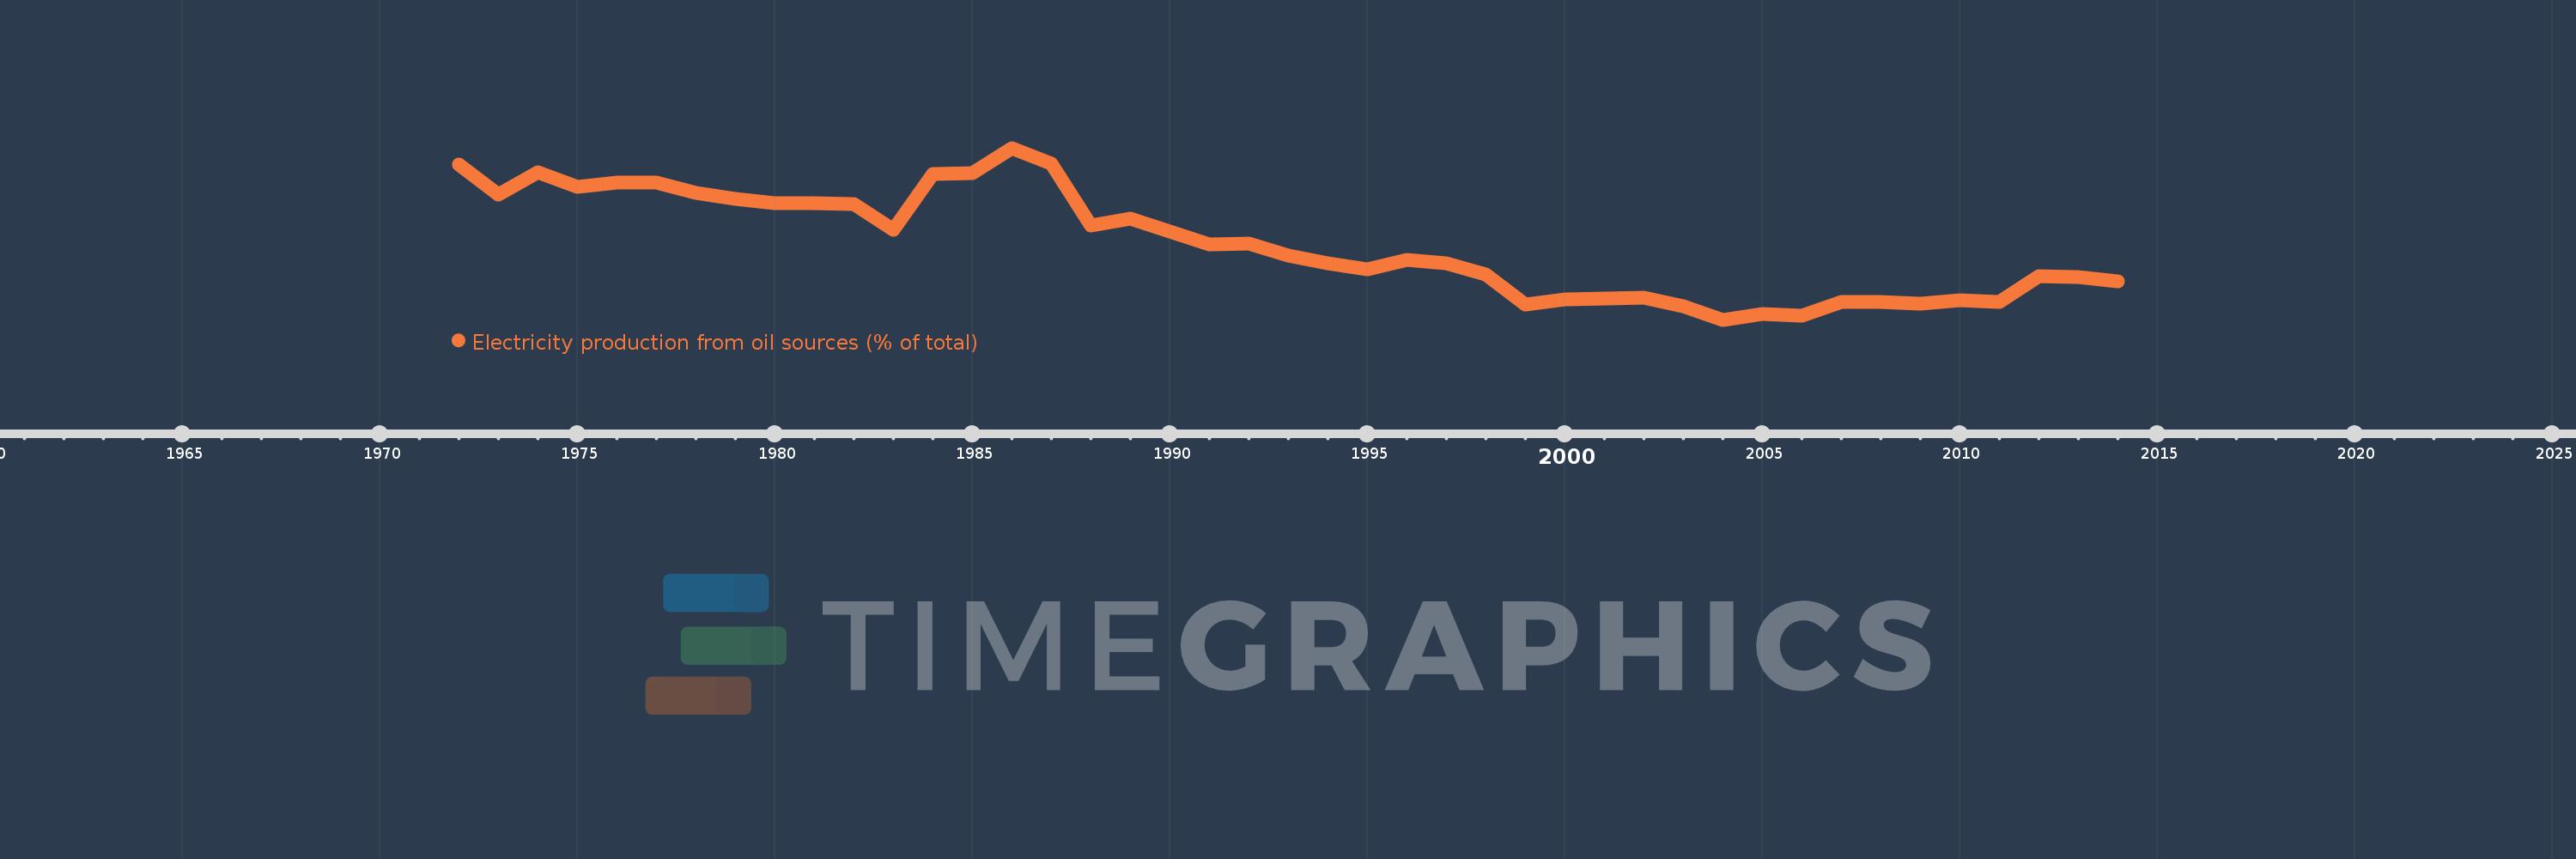
Electricity production from oil sources (% of total)
2014,2013,2012,2011,2010,2009,2008,2007,2006,2005,2004,2003,2002,2001,2000,1999,1998,1997,1996,1995,1994,1993,1992,1991,1990,1989,1988,1987,1986,1985,1984,1983,1982,1981,1980,1979,1978,1977,1976,1975,1974,1973,1972
This statistics in other country:
AlbaniaAlgeriaAngolaArab WorldArgentinaArmeniaAustraliaAustriaAzerbaijanBahrainBangladeshBelarusBelgiumBeninBoliviaBosnia and HerzegovinaBotswanaBrazilBrunei DarussalamBulgariaCambodiaCameroonCanadaCentral Europe and the BalticsChileChinaColombiaCongo, Dem. Rep.Congo, Rep.Costa RicaCote d'IvoireCroatiaCubaCuracaoCyprusCzech RepublicDenmarkDominican RepublicEarly-demographic dividendEast Asia & PacificEast Asia & Pacific (excluding high income)East Asia & Pacific (IDA & IBRD countries)EcuadorEgypt, Arab Rep.El SalvadorEritreaEstoniaEthiopiaEuro areaEurope & Central AsiaEurope & Central Asia (excluding high income)Europe & Central Asia (IDA & IBRD countries)European UnionFinlandFragile and conflict affected situationsFranceGabonGeorgiaGermanyGhanaGibraltarGreeceGuatemalaHaitiHeavily indebted poor countries (HIPC)High incomeHondurasHong Kong SAR, ChinaHungaryIBRD onlyIcelandIDA & IBRD totalIDA blendIDA onlyIDA totalIndiaIndonesiaIran, Islamic Rep.IraqIrelandIsraelItalyJamaicaJapanJordanKazakhstanKenyaKorea, Dem. People’s Rep.Korea, Rep.KosovoKuwaitKyrgyz RepublicLate-demographic dividendLatin America & Caribbean Latin America & Caribbean (excluding high income)Latin America & the Caribbean (IDA & IBRD countries)LatviaLeast developed countries: UN classificationLebanonLibyaLithuaniaLow & middle incomeLower middle incomeLuxembourgMacedonia, FYRMalaysiaMaltaMauritiusMexicoMiddle East & North AfricaMiddle East & North Africa (excluding high income)Middle East & North Africa (IDA & IBRD countries)Middle incomeMoldovaMongoliaMontenegroMoroccoMozambiqueMyanmarNamibiaNepalNetherlandsNew ZealandNicaraguaNigerNigeriaNorth AmericaNorwayOECD membersOmanOther small statesPakistanPanamaParaguayPeruPhilippinesPolandPortugalPost-demographic dividendPre-demographic dividendQatarRomaniaRussian FederationSaudi ArabiaSenegalSerbiaSingaporeSlovak RepublicSloveniaSmall statesSouth AfricaSouth AsiaSouth Asia (IDA & IBRD)South SudanSpainSri LankaSub-Saharan Africa Sub-Saharan Africa (excluding high income)Sub-Saharan Africa (IDA & IBRD countries)SudanSwedenSwitzerlandSyrian Arab RepublicTajikistanTanzaniaThailandTogoTrinidad and TobagoTunisiaTurkeyTurkmenistanUkraineUnited Arab EmiratesUnited KingdomUnited StatesUpper middle incomeUruguayUzbekistanVenezuela, RBVietnamWorldYemen, Rep.ZambiaZimbabwe Timeline:
This timeline shows a graph from 1972 to 2014 of Iran, Islamic Rep.. No data until 1971. Number of actual observations by date: 43.
Source name:
World Development Indicators
Source organization:
IEA Statistics © OECD/IEA 2014 (http://www.iea.org/stats/index.asp), subject to https://www.iea.org/t&c/termsandconditions/
Categories, topics:
Energy & Mining, Climate Change, Infrastructure
Last updated:
apr 23, 2017
Indicators value changes by year
Minimum:
14.504
jan 1, 2004
Maximum:
66.341
jan 1, 1986
At the date of observation
Value
Absolute change
Change from previous value
jan 1, 1972
61.419
+61.419
0.0%
jan 1, 1973
52.392
-9.027
-14.7%
jan 1, 1974
58.96
+6.568
12.54%
jan 1, 1975
54.559
-4.401
-7.46%
jan 1, 1976
55.815
+1.256
2.3%
jan 1, 1977
55.768
-0.047
-0.08%
jan 1, 1978
52.718
-3.05
-5.47%
jan 1, 1979
50.94
-1.778
-3.37%
jan 1, 1980
49.56
-1.38
-2.71%
jan 1, 1981
49.584
+0.025
0.05%
jan 1, 1982
49.402
-0.183
-0.37%
jan 1, 1983
41.629
-7.773
-15.73%
jan 1, 1984
58.602
+16.973
40.77%
jan 1, 1985
58.865
+0.263
0.45%
jan 1, 1986
66.341
+7.476
12.7%
jan 1, 1987
61.495
-4.846
-7.31%
jan 1, 1988
42.998
-18.496
-30.08%
jan 1, 1989
45.017
+2.018
4.69%
jan 1, 1990
41.15
-3.867
-8.59%
jan 1, 1991
37.146
-4.004
-9.73%
jan 1, 1992
37.389
+0.243
0.65%
jan 1, 1993
33.874
-3.515
-9.4%
jan 1, 1994
31.463
-2.411
-7.12%
jan 1, 1995
29.782
-1.681
-5.34%
jan 1, 1996
32.66
+2.878
9.66%
jan 1, 1997
31.652
-1.008
-3.09%
jan 1, 1998
28.218
-3.434
-10.85%
jan 1, 1999
19.083
-9.135
-32.37%
jan 1, 2000
20.769
+1.686
8.84%
jan 1, 2001
20.895
+0.126
0.6%
jan 1, 2002
21.267
+0.372
1.78%
jan 1, 2003
18.562
-2.705
-12.72%
jan 1, 2004
14.504
-4.058
-21.86%
jan 1, 2005
16.197
+1.693
11.67%
jan 1, 2006
15.766
-0.43
-2.66%
jan 1, 2007
19.877
+4.11
26.07%
jan 1, 2008
19.877
+0.0
0.0%
jan 1, 2009
19.374
-0.502
-2.53%
jan 1, 2010
20.417
+1.043
5.38%
jan 1, 2011
19.761
-0.656
-3.21%
jan 1, 2012
27.762
+8.001
40.49%
jan 1, 2013
27.273
-0.49
-1.76%
jan 1, 2014
26.117
-1.156
-4.24%
Ranking of countries by current statistics by years


Comments: