29
/
en
AIzaSyAYiBZKx7MnpbEhh9jyipgxe19OcubqV5w
April 1, 2024
282168
Vietnam
VNM
true
2
1
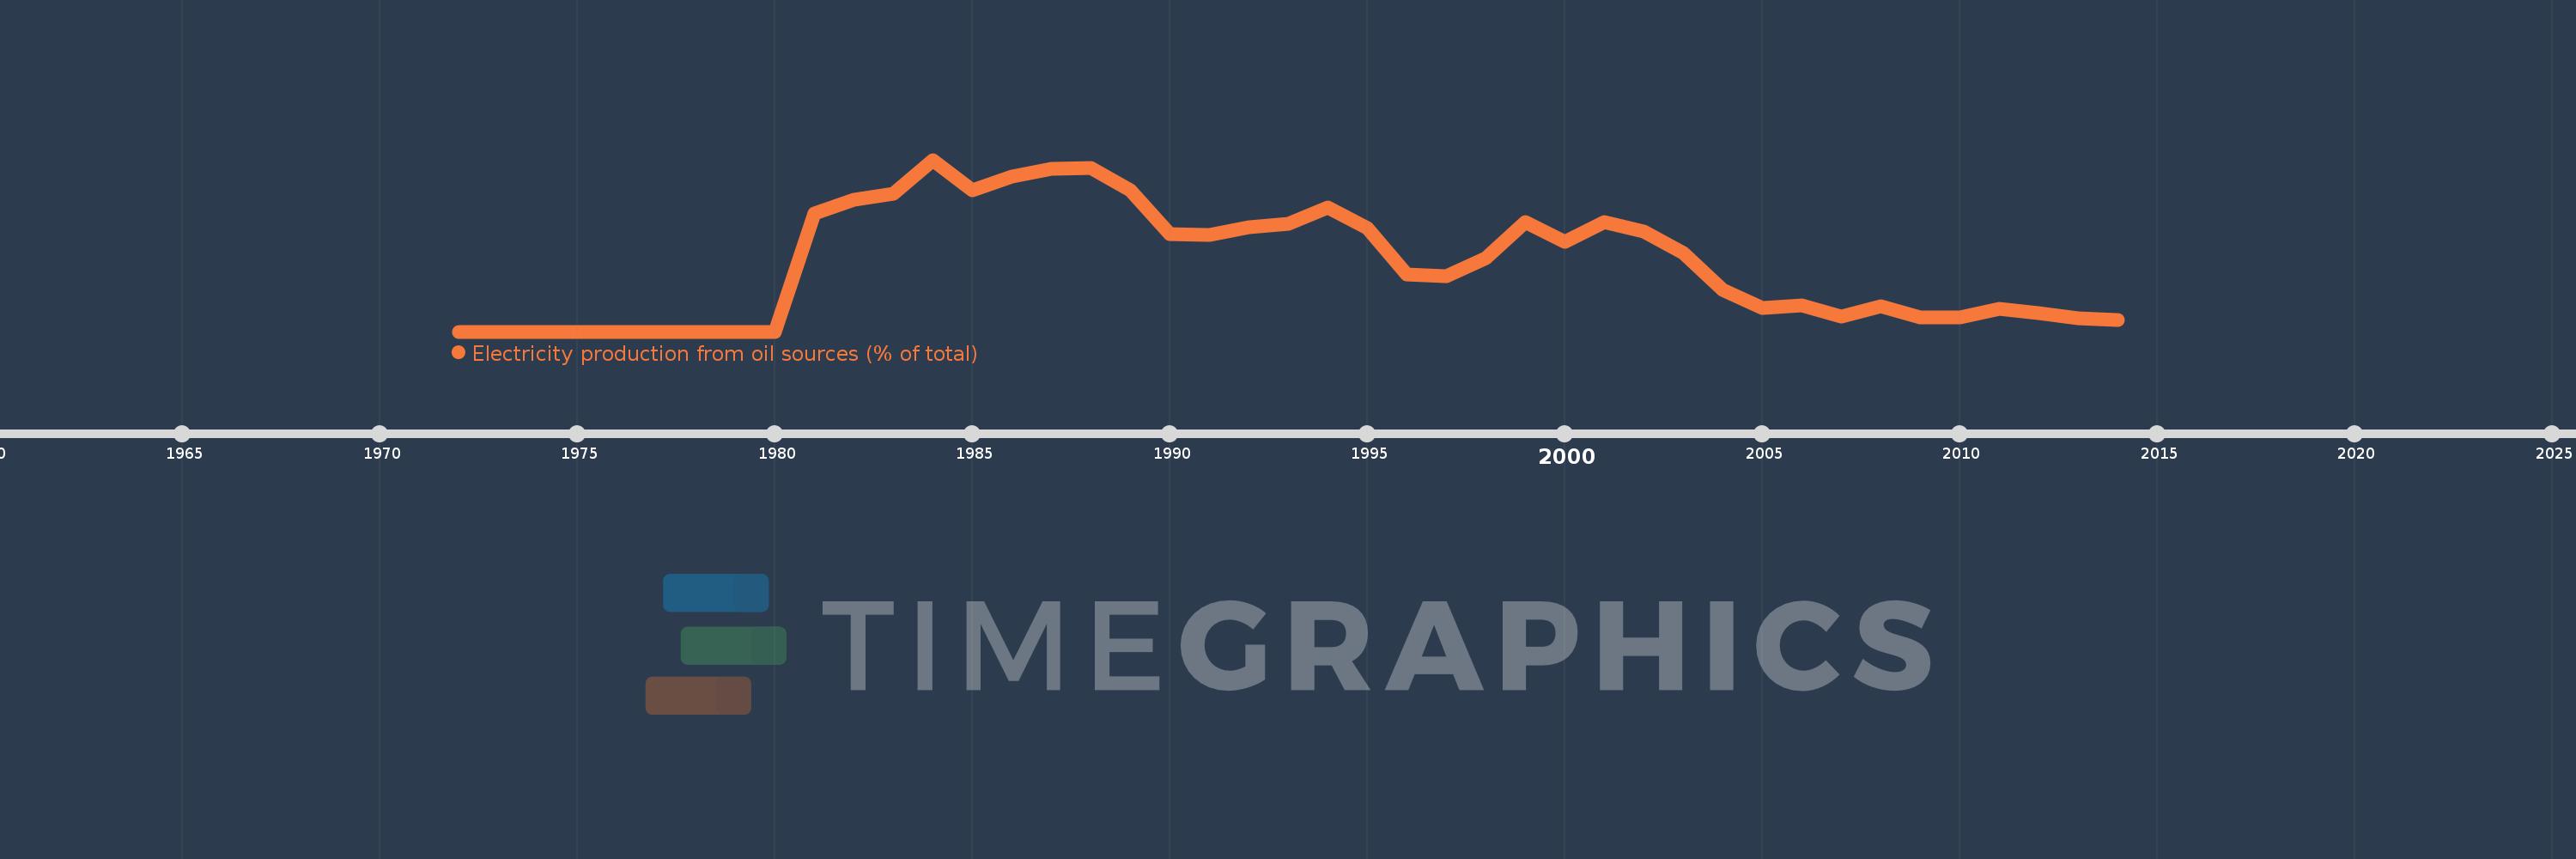
Electricity production from oil sources (% of total)
2014,2013,2012,2011,2010,2009,2008,2007,2006,2005,2004,2003,2002,2001,2000,1999,1998,1997,1996,1995,1994,1993,1992,1991,1990,1989,1988,1987,1986,1985,1984,1983,1982,1981,1980,1979,1978,1977,1976,1975,1974,1973,1972
This statistics in other country:
AlbaniaAlgeriaAngolaArab WorldArgentinaArmeniaAustraliaAustriaAzerbaijanBahrainBangladeshBelarusBelgiumBeninBoliviaBosnia and HerzegovinaBotswanaBrazilBrunei DarussalamBulgariaCambodiaCameroonCanadaCentral Europe and the BalticsChileChinaColombiaCongo, Dem. Rep.Congo, Rep.Costa RicaCote d'IvoireCroatiaCubaCuracaoCyprusCzech RepublicDenmarkDominican RepublicEarly-demographic dividendEast Asia & PacificEast Asia & Pacific (excluding high income)East Asia & Pacific (IDA & IBRD countries)EcuadorEgypt, Arab Rep.El SalvadorEritreaEstoniaEthiopiaEuro areaEurope & Central AsiaEurope & Central Asia (excluding high income)Europe & Central Asia (IDA & IBRD countries)European UnionFinlandFragile and conflict affected situationsFranceGabonGeorgiaGermanyGhanaGibraltarGreeceGuatemalaHaitiHeavily indebted poor countries (HIPC)High incomeHondurasHong Kong SAR, ChinaHungaryIBRD onlyIcelandIDA & IBRD totalIDA blendIDA onlyIDA totalIndiaIndonesiaIran, Islamic Rep.IraqIrelandIsraelItalyJamaicaJapanJordanKazakhstanKenyaKorea, Dem. People’s Rep.Korea, Rep.KosovoKuwaitKyrgyz RepublicLate-demographic dividendLatin America & Caribbean Latin America & Caribbean (excluding high income)Latin America & the Caribbean (IDA & IBRD countries)LatviaLeast developed countries: UN classificationLebanonLibyaLithuaniaLow & middle incomeLower middle incomeLuxembourgMacedonia, FYRMalaysiaMaltaMauritiusMexicoMiddle East & North AfricaMiddle East & North Africa (excluding high income)Middle East & North Africa (IDA & IBRD countries)Middle incomeMoldovaMongoliaMontenegroMoroccoMozambiqueMyanmarNamibiaNepalNetherlandsNew ZealandNicaraguaNigerNigeriaNorth AmericaNorwayOECD membersOmanOther small statesPakistanPanamaParaguayPeruPhilippinesPolandPortugalPost-demographic dividendPre-demographic dividendQatarRomaniaRussian FederationSaudi ArabiaSenegalSerbiaSingaporeSlovak RepublicSloveniaSmall statesSouth AfricaSouth AsiaSouth Asia (IDA & IBRD)South SudanSpainSri LankaSub-Saharan Africa Sub-Saharan Africa (excluding high income)Sub-Saharan Africa (IDA & IBRD countries)SudanSwedenSwitzerlandSyrian Arab RepublicTajikistanTanzaniaThailandTogoTrinidad and TobagoTunisiaTurkeyTurkmenistanUkraineUnited Arab EmiratesUnited KingdomUnited StatesUpper middle incomeUruguayUzbekistanVenezuela, RBVietnamWorldYemen, Rep.ZambiaZimbabwe Timeline:
This timeline shows a graph from 1972 to 2014 of Vietnam. No data until 1971. Number of actual observations by date: 43.
Source name:
World Development Indicators
Source organization:
IEA Statistics © OECD/IEA 2014 (http://www.iea.org/stats/index.asp), subject to https://www.iea.org/t&c/termsandconditions/
Categories, topics:
Energy & Mining, Climate Change, Infrastructure
Last updated:
apr 23, 2017
Indicators value changes by year
Maximum:
26.643
jan 1, 1984
At the date of observation
Value
Absolute change
Change from previous value
jan 1, 1981
18.264
+18.264
%
jan 1, 1982
20.411
+2.148
11.76%
jan 1, 1983
21.316
+0.905
4.43%
jan 1, 1984
26.643
+5.327
24.99%
jan 1, 1985
21.976
-4.668
-17.52%
jan 1, 1986
23.989
+2.013
9.16%
jan 1, 1987
25.276
+1.287
5.36%
jan 1, 1988
25.384
+0.108
0.43%
jan 1, 1989
21.96
-3.424
-13.49%
jan 1, 1990
15.185
-6.775
-30.85%
jan 1, 1991
15.033
-0.152
-1.0%
jan 1, 1992
16.2
+1.167
7.76%
jan 1, 1993
16.692
+0.493
3.04%
jan 1, 1994
19.19
+2.497
14.96%
jan 1, 1995
16.032
-3.158
-16.46%
jan 1, 1996
8.841
-7.191
-44.85%
jan 1, 1997
8.634
-0.206
-2.34%
jan 1, 1998
11.379
+2.745
31.79%
jan 1, 1999
16.949
+5.571
48.96%
jan 1, 2000
13.897
-3.052
-18.01%
jan 1, 2001
17.014
+3.117
22.43%
jan 1, 2002
15.542
-1.472
-8.65%
jan 1, 2003
12.253
-3.289
-21.16%
jan 1, 2004
6.495
-5.758
-46.99%
jan 1, 2005
3.646
-2.848
-43.86%
jan 1, 2006
4.039
+0.392
10.76%
jan 1, 2007
2.321
-1.718
-42.53%
jan 1, 2008
3.964
+1.643
70.78%
jan 1, 2009
2.138
-1.826
-46.07%
jan 1, 2010
2.146
+0.008
0.39%
jan 1, 2011
3.593
+1.447
67.43%
jan 1, 2012
2.84
-0.753
-20.96%
jan 1, 2013
2.012
-0.828
-29.16%
jan 1, 2014
1.786
-0.226
-11.21%
Ranking of countries by current statistics by years


Comments: