29
/
en
AIzaSyAYiBZKx7MnpbEhh9jyipgxe19OcubqV5w
April 1, 2024
26429
Early-demographic dividend
EAR
false
2
1
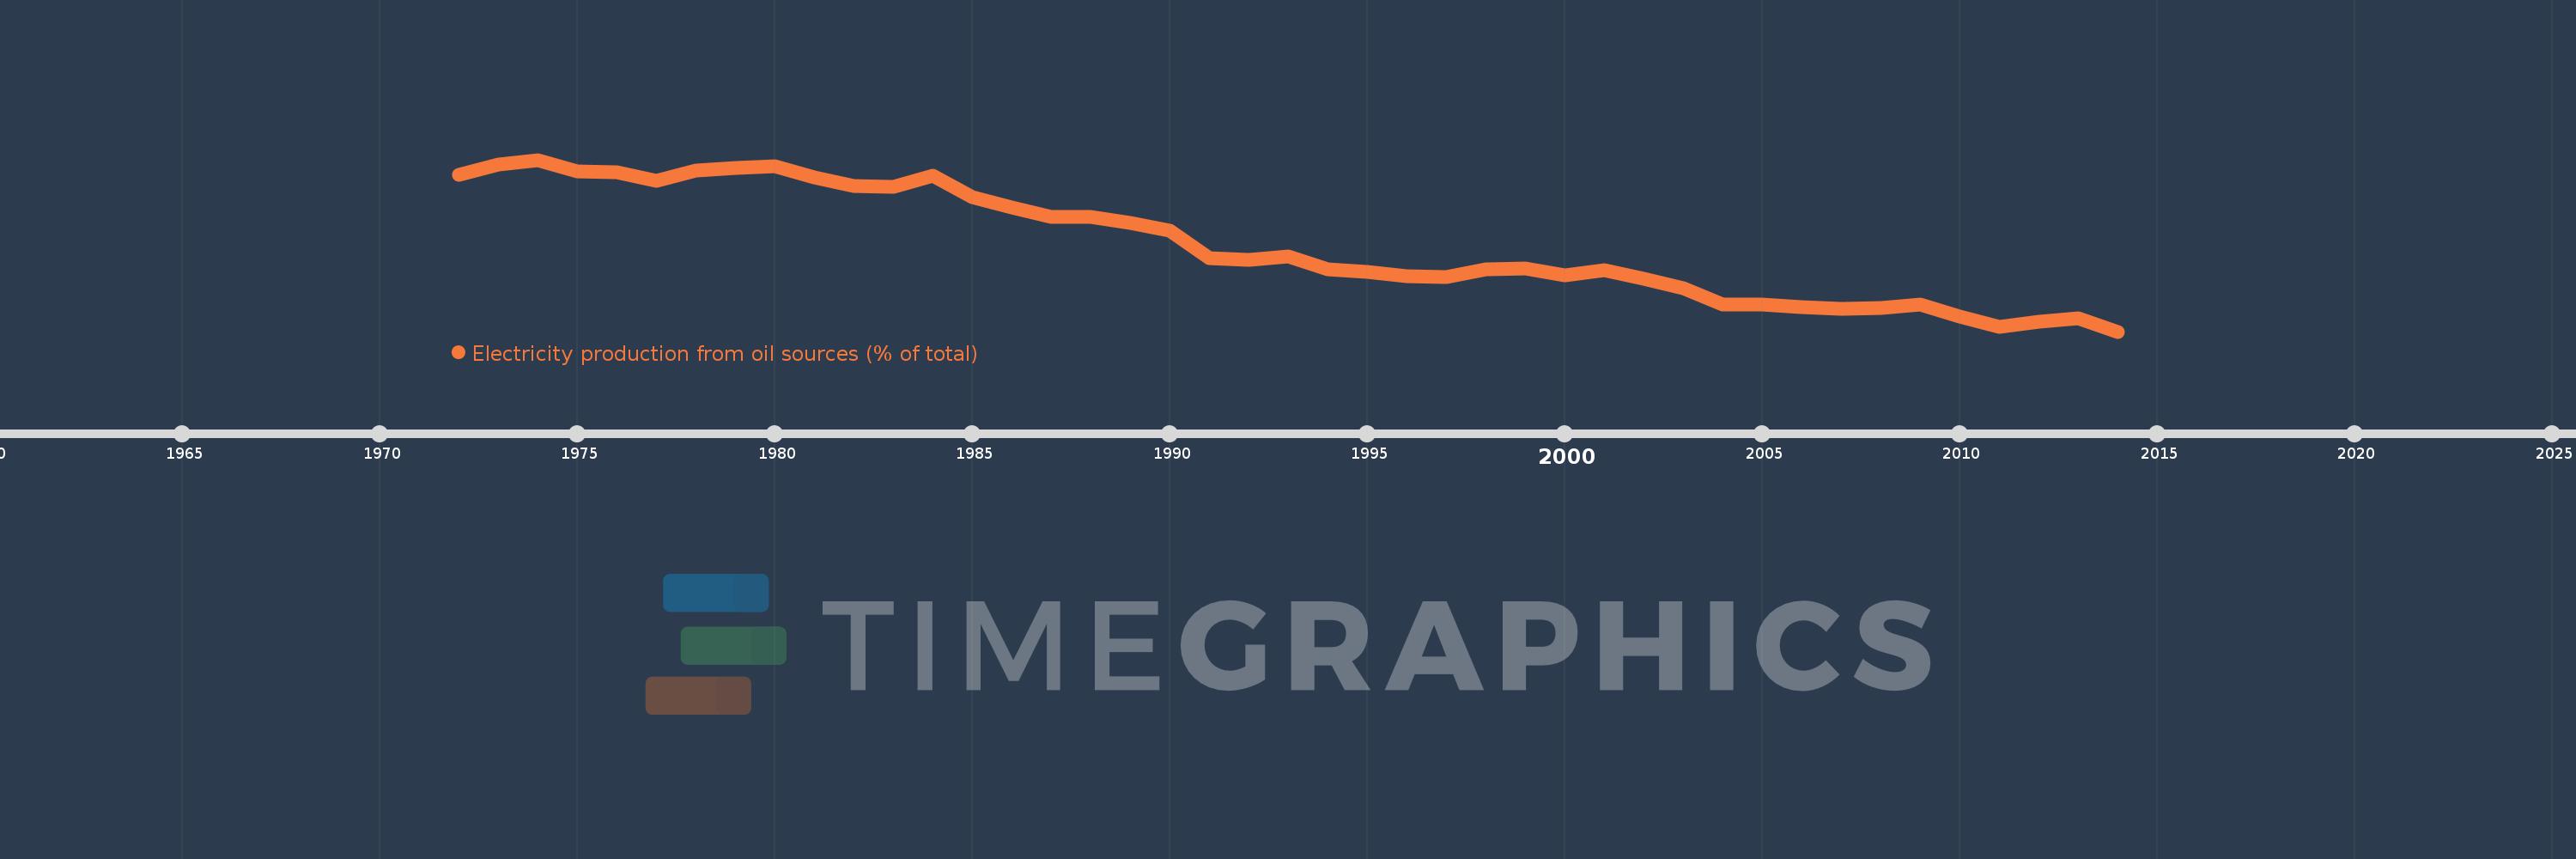
Electricity production from oil sources (% of total)
2014,2013,2012,2011,2010,2009,2008,2007,2006,2005,2004,2003,2002,2001,2000,1999,1998,1997,1996,1995,1994,1993,1992,1991,1990,1989,1988,1987,1986,1985,1984,1983,1982,1981,1980,1979,1978,1977,1976,1975,1974,1973,1972
This statistics in other country:
AlbaniaAlgeriaAngolaArab WorldArgentinaArmeniaAustraliaAustriaAzerbaijanBahrainBangladeshBelarusBelgiumBeninBoliviaBosnia and HerzegovinaBotswanaBrazilBrunei DarussalamBulgariaCambodiaCameroonCanadaCentral Europe and the BalticsChileChinaColombiaCongo, Dem. Rep.Congo, Rep.Costa RicaCote d'IvoireCroatiaCubaCuracaoCyprusCzech RepublicDenmarkDominican RepublicEarly-demographic dividendEast Asia & PacificEast Asia & Pacific (excluding high income)East Asia & Pacific (IDA & IBRD countries)EcuadorEgypt, Arab Rep.El SalvadorEritreaEstoniaEthiopiaEuro areaEurope & Central AsiaEurope & Central Asia (excluding high income)Europe & Central Asia (IDA & IBRD countries)European UnionFinlandFragile and conflict affected situationsFranceGabonGeorgiaGermanyGhanaGibraltarGreeceGuatemalaHaitiHeavily indebted poor countries (HIPC)High incomeHondurasHong Kong SAR, ChinaHungaryIBRD onlyIcelandIDA & IBRD totalIDA blendIDA onlyIDA totalIndiaIndonesiaIran, Islamic Rep.IraqIrelandIsraelItalyJamaicaJapanJordanKazakhstanKenyaKorea, Dem. People’s Rep.Korea, Rep.KosovoKuwaitKyrgyz RepublicLate-demographic dividendLatin America & Caribbean Latin America & Caribbean (excluding high income)Latin America & the Caribbean (IDA & IBRD countries)LatviaLeast developed countries: UN classificationLebanonLibyaLithuaniaLow & middle incomeLower middle incomeLuxembourgMacedonia, FYRMalaysiaMaltaMauritiusMexicoMiddle East & North AfricaMiddle East & North Africa (excluding high income)Middle East & North Africa (IDA & IBRD countries)Middle incomeMoldovaMongoliaMontenegroMoroccoMozambiqueMyanmarNamibiaNepalNetherlandsNew ZealandNicaraguaNigerNigeriaNorth AmericaNorwayOECD membersOmanOther small statesPakistanPanamaParaguayPeruPhilippinesPolandPortugalPost-demographic dividendPre-demographic dividendQatarRomaniaRussian FederationSaudi ArabiaSenegalSerbiaSingaporeSlovak RepublicSloveniaSmall statesSouth AfricaSouth AsiaSouth Asia (IDA & IBRD)South SudanSpainSri LankaSub-Saharan Africa Sub-Saharan Africa (excluding high income)Sub-Saharan Africa (IDA & IBRD countries)SudanSwedenSwitzerlandSyrian Arab RepublicTajikistanTanzaniaThailandTogoTrinidad and TobagoTunisiaTurkeyTurkmenistanUkraineUnited Arab EmiratesUnited KingdomUnited StatesUpper middle incomeUruguayUzbekistanVenezuela, RBVietnamWorldYemen, Rep.ZambiaZimbabwe Timeline:
This timeline shows a graph from 1972 to 2014 of Early-demographic dividend. No data until 1971. Number of actual observations by date: 43.
Source name:
World Development Indicators
Source organization:
IEA Statistics © OECD/IEA 2014 (http://www.iea.org/stats/index.asp), subject to https://www.iea.org/t&c/termsandconditions/
Categories, topics:
Energy & Mining, Climate Change, Infrastructure
Last updated:
apr 23, 2017
Indicators value changes by year
Maximum:
26.674
jan 1, 1974
At the date of observation
Value
Absolute change
Change from previous value
jan 1, 1972
25.238
+25.238
0.0%
jan 1, 1973
26.24
+1.002
3.97%
jan 1, 1974
26.674
+0.434
1.66%
jan 1, 1975
25.606
-1.068
-4.0%
jan 1, 1976
25.506
-0.1
-0.39%
jan 1, 1977
24.737
-0.769
-3.02%
jan 1, 1978
25.685
+0.948
3.83%
jan 1, 1979
25.896
+0.211
0.82%
jan 1, 1980
26.084
+0.188
0.72%
jan 1, 1981
25.024
-1.06
-4.06%
jan 1, 1982
24.232
-0.792
-3.17%
jan 1, 1983
24.159
-0.073
-0.3%
jan 1, 1984
25.192
+1.033
4.28%
jan 1, 1985
23.181
-2.011
-7.98%
jan 1, 1986
22.22
-0.961
-4.15%
jan 1, 1987
21.378
-0.842
-3.79%
jan 1, 1988
21.333
-0.045
-0.21%
jan 1, 1989
20.754
-0.579
-2.71%
jan 1, 1990
20.055
-0.699
-3.37%
jan 1, 1991
17.52
-2.535
-12.64%
jan 1, 1992
17.36
-0.159
-0.91%
jan 1, 1993
17.641
+0.28
1.62%
jan 1, 1994
16.507
-1.134
-6.43%
jan 1, 1995
16.256
-0.25
-1.52%
jan 1, 1996
15.821
-0.435
-2.68%
jan 1, 1997
15.748
-0.073
-0.46%
jan 1, 1998
16.447
+0.699
4.44%
jan 1, 1999
16.57
+0.123
0.75%
jan 1, 2000
15.875
-0.695
-4.19%
jan 1, 2001
16.356
+0.48
3.03%
jan 1, 2002
15.567
-0.789
-4.82%
jan 1, 2003
14.68
-0.887
-5.7%
jan 1, 2004
13.174
-1.506
-10.26%
jan 1, 2005
13.182
+0.008
0.06%
jan 1, 2006
12.988
-0.194
-1.47%
jan 1, 2007
12.763
-0.225
-1.73%
jan 1, 2008
12.841
+0.078
0.61%
jan 1, 2009
13.188
+0.348
2.71%
jan 1, 2010
12.085
-1.103
-8.36%
jan 1, 2011
11.132
-0.953
-7.89%
jan 1, 2012
11.619
+0.487
4.37%
jan 1, 2013
11.886
+0.267
2.3%
jan 1, 2014
10.67
-1.216
-10.23%
Ranking of countries by current statistics by years


Comments: