29
/
en
AIzaSyAYiBZKx7MnpbEhh9jyipgxe19OcubqV5w
April 1, 2024
252913
Sudan
SDN
true
2
1
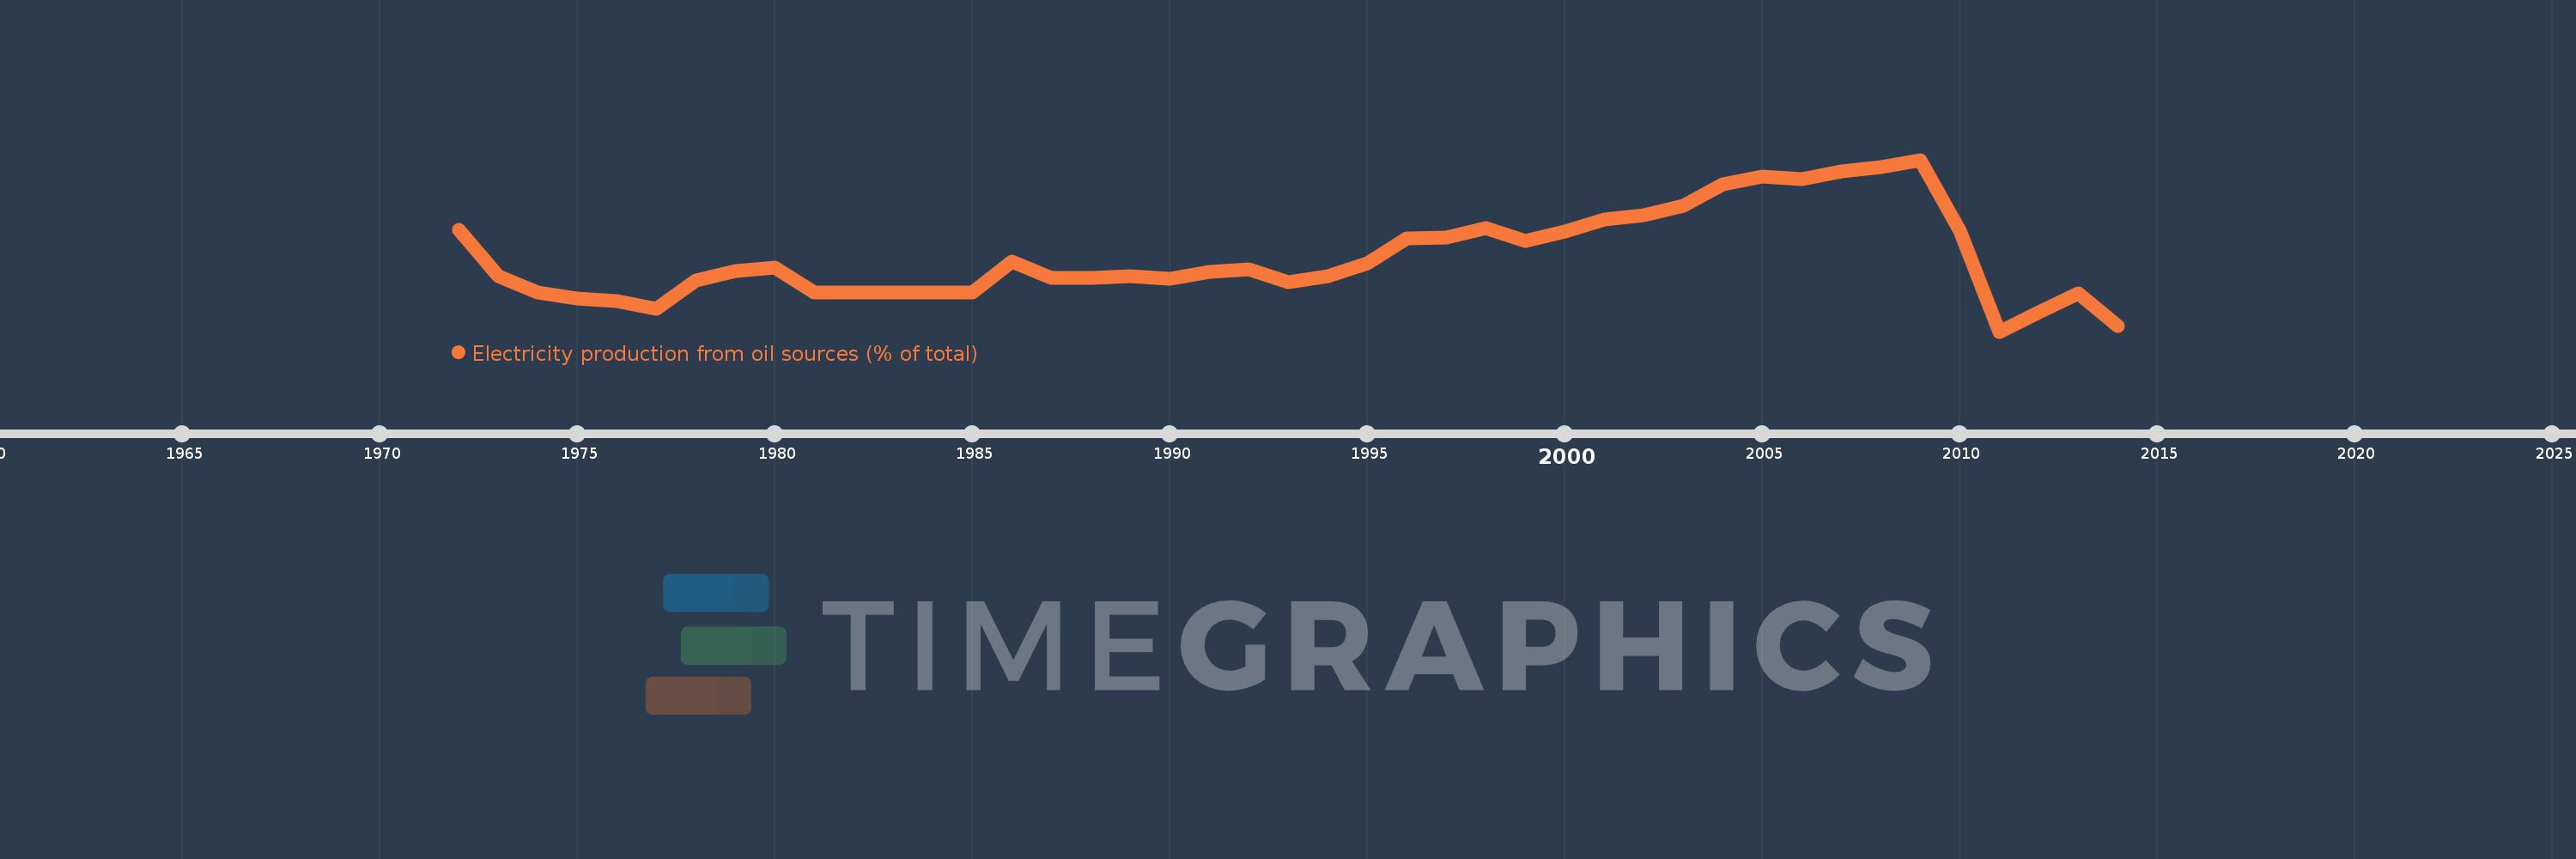
Electricity production from oil sources (% of total)
2014,2013,2012,2011,2010,2009,2008,2007,2006,2005,2004,2003,2002,2001,2000,1999,1998,1997,1996,1995,1994,1993,1992,1991,1990,1989,1988,1987,1986,1985,1984,1983,1982,1981,1980,1979,1978,1977,1976,1975,1974,1973,1972
This statistics in other country:
AlbaniaAlgeriaAngolaArab WorldArgentinaArmeniaAustraliaAustriaAzerbaijanBahrainBangladeshBelarusBelgiumBeninBoliviaBosnia and HerzegovinaBotswanaBrazilBrunei DarussalamBulgariaCambodiaCameroonCanadaCentral Europe and the BalticsChileChinaColombiaCongo, Dem. Rep.Congo, Rep.Costa RicaCote d'IvoireCroatiaCubaCuracaoCyprusCzech RepublicDenmarkDominican RepublicEarly-demographic dividendEast Asia & PacificEast Asia & Pacific (excluding high income)East Asia & Pacific (IDA & IBRD countries)EcuadorEgypt, Arab Rep.El SalvadorEritreaEstoniaEthiopiaEuro areaEurope & Central AsiaEurope & Central Asia (excluding high income)Europe & Central Asia (IDA & IBRD countries)European UnionFinlandFragile and conflict affected situationsFranceGabonGeorgiaGermanyGhanaGibraltarGreeceGuatemalaHaitiHeavily indebted poor countries (HIPC)High incomeHondurasHong Kong SAR, ChinaHungaryIBRD onlyIcelandIDA & IBRD totalIDA blendIDA onlyIDA totalIndiaIndonesiaIran, Islamic Rep.IraqIrelandIsraelItalyJamaicaJapanJordanKazakhstanKenyaKorea, Dem. People’s Rep.Korea, Rep.KosovoKuwaitKyrgyz RepublicLate-demographic dividendLatin America & Caribbean Latin America & Caribbean (excluding high income)Latin America & the Caribbean (IDA & IBRD countries)LatviaLeast developed countries: UN classificationLebanonLibyaLithuaniaLow & middle incomeLower middle incomeLuxembourgMacedonia, FYRMalaysiaMaltaMauritiusMexicoMiddle East & North AfricaMiddle East & North Africa (excluding high income)Middle East & North Africa (IDA & IBRD countries)Middle incomeMoldovaMongoliaMontenegroMoroccoMozambiqueMyanmarNamibiaNepalNetherlandsNew ZealandNicaraguaNigerNigeriaNorth AmericaNorwayOECD membersOmanOther small statesPakistanPanamaParaguayPeruPhilippinesPolandPortugalPost-demographic dividendPre-demographic dividendQatarRomaniaRussian FederationSaudi ArabiaSenegalSerbiaSingaporeSlovak RepublicSloveniaSmall statesSouth AfricaSouth AsiaSouth Asia (IDA & IBRD)South SudanSpainSri LankaSub-Saharan Africa Sub-Saharan Africa (excluding high income)Sub-Saharan Africa (IDA & IBRD countries)SudanSwedenSwitzerlandSyrian Arab RepublicTajikistanTanzaniaThailandTogoTrinidad and TobagoTunisiaTurkeyTurkmenistanUkraineUnited Arab EmiratesUnited KingdomUnited StatesUpper middle incomeUruguayUzbekistanVenezuela, RBVietnamWorldYemen, Rep.ZambiaZimbabwe Timeline:
This timeline shows a graph from 1972 to 2014 of Sudan. No data until 1971. Number of actual observations by date: 43.
Source name:
World Development Indicators
Source organization:
IEA Statistics © OECD/IEA 2014 (http://www.iea.org/stats/index.asp), subject to https://www.iea.org/t&c/termsandconditions/
Categories, topics:
Energy & Mining, Climate Change, Infrastructure
Last updated:
apr 23, 2017
Indicators value changes by year
Minimum:
17.296
jan 1, 2011
Maximum:
73.429
jan 1, 2009
At the date of observation
Value
Absolute change
Change from previous value
jan 1, 1972
50.505
+50.505
0.0%
jan 1, 1973
35.284
-15.221
-30.14%
jan 1, 1974
30.0
-5.284
-14.97%
jan 1, 1975
28.173
-1.827
-6.09%
jan 1, 1976
27.391
-0.782
-2.78%
jan 1, 1977
24.7
-2.692
-9.83%
jan 1, 1978
33.915
+9.216
37.31%
jan 1, 1979
36.994
+3.079
9.08%
jan 1, 1980
38.278
+1.284
3.47%
jan 1, 1981
29.988
-8.29
-21.66%
jan 1, 1982
29.964
-0.023
-0.08%
jan 1, 1983
29.967
+0.002
0.01%
jan 1, 1984
30.011
+0.044
0.15%
jan 1, 1985
30.01
-0.001
0.0%
jan 1, 1986
40.033
+10.022
33.4%
jan 1, 1987
34.828
-5.204
-13.0%
jan 1, 1988
34.808
-0.02
-0.06%
jan 1, 1989
35.269
+0.461
1.32%
jan 1, 1990
34.432
-0.836
-2.37%
jan 1, 1991
36.766
+2.333
6.78%
jan 1, 1992
37.508
+0.742
2.02%
jan 1, 1993
33.354
-4.154
-11.07%
jan 1, 1994
35.291
+1.937
5.81%
jan 1, 1995
39.666
+4.376
12.4%
jan 1, 1996
47.854
+8.188
20.64%
jan 1, 1997
47.94
+0.086
0.18%
jan 1, 1998
50.977
+3.037
6.33%
jan 1, 1999
46.948
-4.029
-7.9%
jan 1, 2000
50.062
+3.114
6.63%
jan 1, 2001
53.951
+3.889
7.77%
jan 1, 2002
55.352
+1.401
2.6%
jan 1, 2003
58.39
+3.038
5.49%
jan 1, 2004
65.325
+6.935
11.88%
jan 1, 2005
68.07
+2.745
4.2%
jan 1, 2006
67.041
-1.029
-1.51%
jan 1, 2007
69.697
+2.656
3.96%
jan 1, 2008
71.101
+1.404
2.02%
jan 1, 2009
73.429
+2.328
3.27%
jan 1, 2010
50.27
-23.159
-31.54%
jan 1, 2011
17.296
-32.974
-65.59%
jan 1, 2012
23.513
+6.217
35.95%
jan 1, 2013
29.854
+6.341
26.97%
jan 1, 2014
19.146
-10.708
-35.87%
Ranking of countries by current statistics by years


Comments: