29
/
en
AIzaSyAYiBZKx7MnpbEhh9jyipgxe19OcubqV5w
April 1, 2024
40626
Late-demographic dividend
LTE
false
2
1
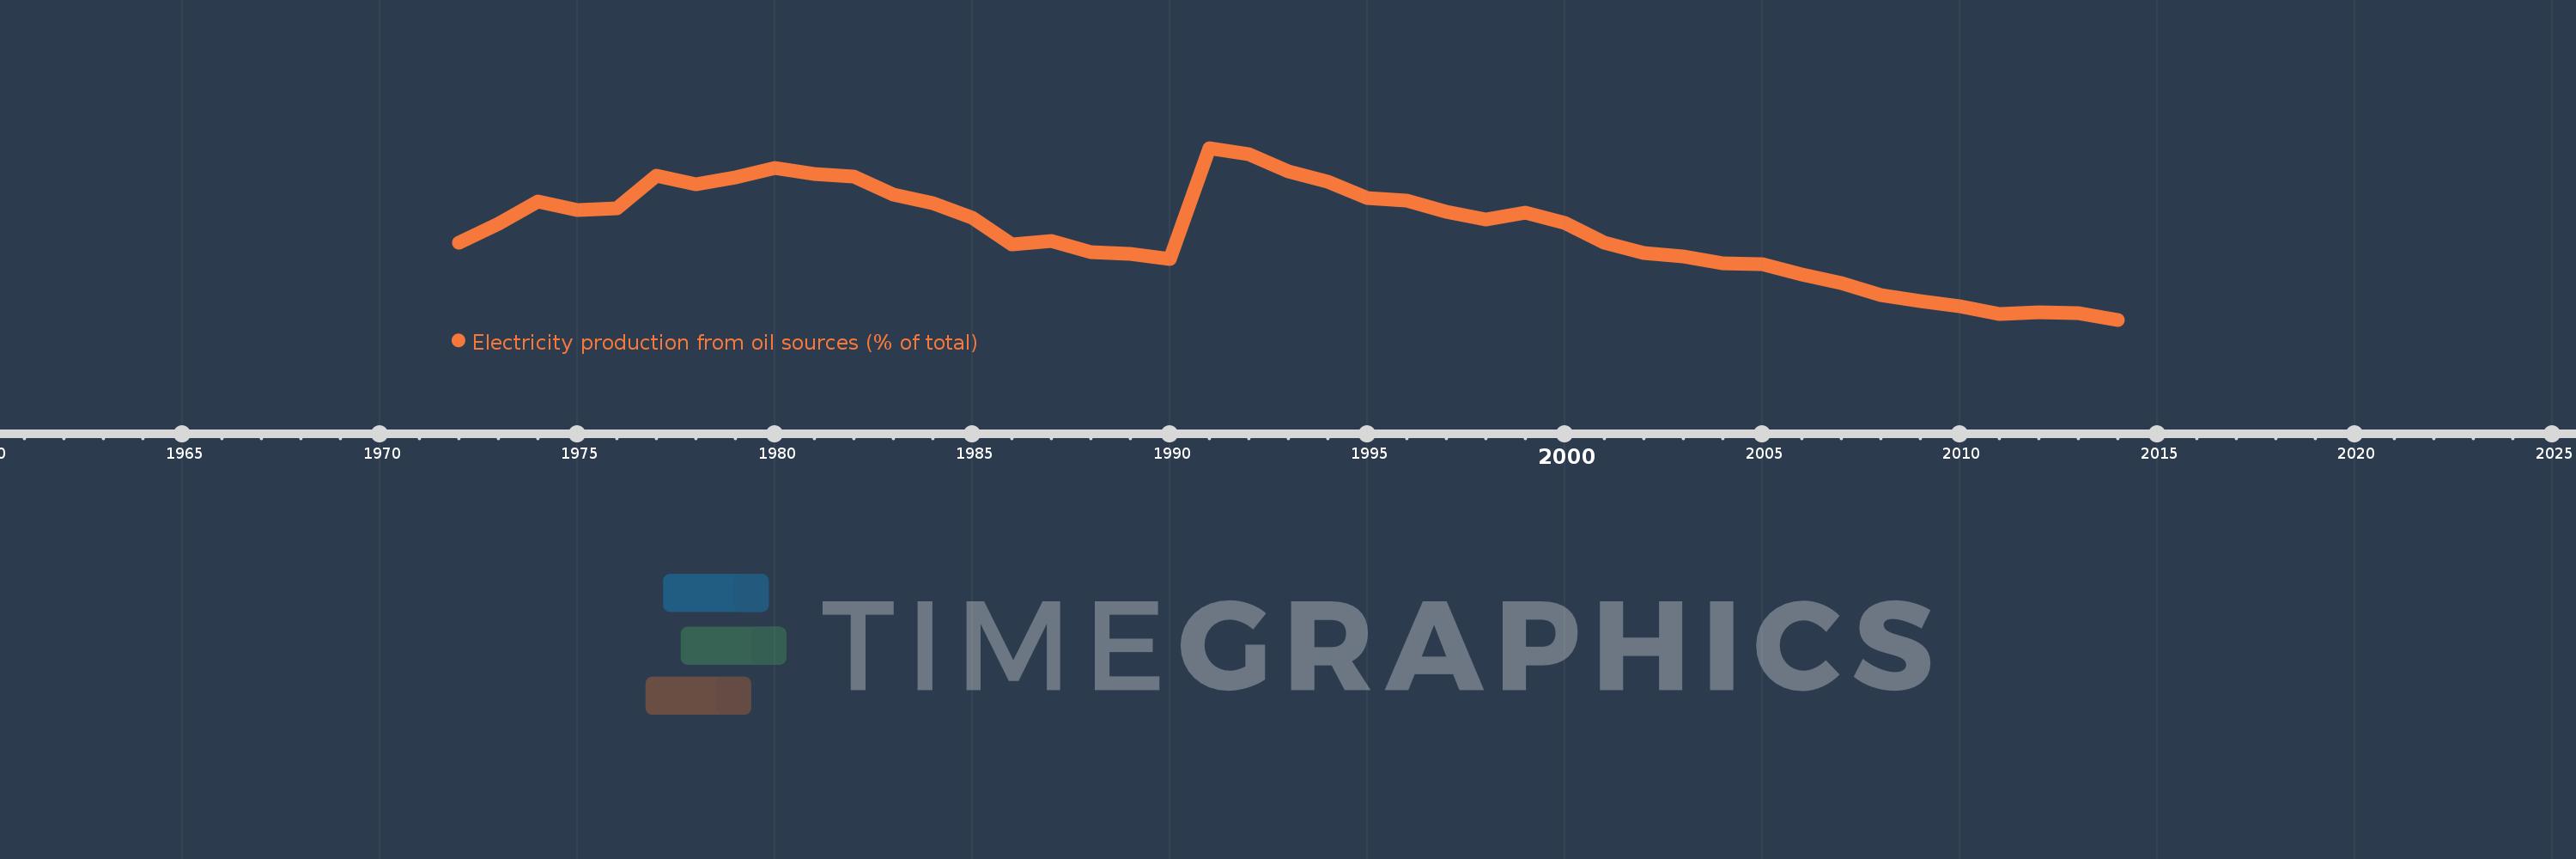
Electricity production from oil sources (% of total)
2014,2013,2012,2011,2010,2009,2008,2007,2006,2005,2004,2003,2002,2001,2000,1999,1998,1997,1996,1995,1994,1993,1992,1991,1990,1989,1988,1987,1986,1985,1984,1983,1982,1981,1980,1979,1978,1977,1976,1975,1974,1973,1972
This statistics in other country:
AlbaniaAlgeriaAngolaArab WorldArgentinaArmeniaAustraliaAustriaAzerbaijanBahrainBangladeshBelarusBelgiumBeninBoliviaBosnia and HerzegovinaBotswanaBrazilBrunei DarussalamBulgariaCambodiaCameroonCanadaCentral Europe and the BalticsChileChinaColombiaCongo, Dem. Rep.Congo, Rep.Costa RicaCote d'IvoireCroatiaCubaCuracaoCyprusCzech RepublicDenmarkDominican RepublicEarly-demographic dividendEast Asia & PacificEast Asia & Pacific (excluding high income)East Asia & Pacific (IDA & IBRD countries)EcuadorEgypt, Arab Rep.El SalvadorEritreaEstoniaEthiopiaEuro areaEurope & Central AsiaEurope & Central Asia (excluding high income)Europe & Central Asia (IDA & IBRD countries)European UnionFinlandFragile and conflict affected situationsFranceGabonGeorgiaGermanyGhanaGibraltarGreeceGuatemalaHaitiHeavily indebted poor countries (HIPC)High incomeHondurasHong Kong SAR, ChinaHungaryIBRD onlyIcelandIDA & IBRD totalIDA blendIDA onlyIDA totalIndiaIndonesiaIran, Islamic Rep.IraqIrelandIsraelItalyJamaicaJapanJordanKazakhstanKenyaKorea, Dem. People’s Rep.Korea, Rep.KosovoKuwaitKyrgyz RepublicLate-demographic dividendLatin America & Caribbean Latin America & Caribbean (excluding high income)Latin America & the Caribbean (IDA & IBRD countries)LatviaLeast developed countries: UN classificationLebanonLibyaLithuaniaLow & middle incomeLower middle incomeLuxembourgMacedonia, FYRMalaysiaMaltaMauritiusMexicoMiddle East & North AfricaMiddle East & North Africa (excluding high income)Middle East & North Africa (IDA & IBRD countries)Middle incomeMoldovaMongoliaMontenegroMoroccoMozambiqueMyanmarNamibiaNepalNetherlandsNew ZealandNicaraguaNigerNigeriaNorth AmericaNorwayOECD membersOmanOther small statesPakistanPanamaParaguayPeruPhilippinesPolandPortugalPost-demographic dividendPre-demographic dividendQatarRomaniaRussian FederationSaudi ArabiaSenegalSerbiaSingaporeSlovak RepublicSloveniaSmall statesSouth AfricaSouth AsiaSouth Asia (IDA & IBRD)South SudanSpainSri LankaSub-Saharan Africa Sub-Saharan Africa (excluding high income)Sub-Saharan Africa (IDA & IBRD countries)SudanSwedenSwitzerlandSyrian Arab RepublicTajikistanTanzaniaThailandTogoTrinidad and TobagoTunisiaTurkeyTurkmenistanUkraineUnited Arab EmiratesUnited KingdomUnited StatesUpper middle incomeUruguayUzbekistanVenezuela, RBVietnamWorldYemen, Rep.ZambiaZimbabwe Timeline:
This timeline shows a graph from 1972 to 2014 of Late-demographic dividend. No data until 1971. Number of actual observations by date: 43.
Source name:
World Development Indicators
Source organization:
IEA Statistics © OECD/IEA 2014 (http://www.iea.org/stats/index.asp), subject to https://www.iea.org/t&c/termsandconditions/
Categories, topics:
Energy & Mining, Climate Change, Infrastructure
Last updated:
apr 23, 2017
Indicators value changes by year
Maximum:
10.595
jan 1, 1991
At the date of observation
Value
Absolute change
Change from previous value
jan 1, 1972
5.636
+5.636
0.0%
jan 1, 1973
6.655
+1.019
18.09%
jan 1, 1974
7.808
+1.153
17.33%
jan 1, 1975
7.338
-0.47
-6.02%
jan 1, 1976
7.463
+0.124
1.7%
jan 1, 1977
9.144
+1.681
22.52%
jan 1, 1978
8.692
-0.452
-4.94%
jan 1, 1979
9.061
+0.369
4.25%
jan 1, 1980
9.57
+0.509
5.61%
jan 1, 1981
9.231
-0.339
-3.54%
jan 1, 1982
9.124
-0.107
-1.16%
jan 1, 1983
8.181
-0.943
-10.34%
jan 1, 1984
7.726
-0.455
-5.56%
jan 1, 1985
6.971
-0.755
-9.77%
jan 1, 1986
5.585
-1.386
-19.88%
jan 1, 1987
5.741
+0.156
2.8%
jan 1, 1988
5.182
-0.559
-9.74%
jan 1, 1989
5.094
-0.088
-1.7%
jan 1, 1990
4.819
-0.275
-5.4%
jan 1, 1991
10.595
+5.776
119.86%
jan 1, 1992
10.275
-0.321
-3.03%
jan 1, 1993
9.379
-0.896
-8.72%
jan 1, 1994
8.828
-0.551
-5.87%
jan 1, 1995
8.006
-0.822
-9.31%
jan 1, 1996
7.862
-0.145
-1.81%
jan 1, 1997
7.278
-0.583
-7.42%
jan 1, 1998
6.851
-0.428
-5.87%
jan 1, 1999
7.219
+0.368
5.37%
jan 1, 2000
6.704
-0.514
-7.13%
jan 1, 2001
5.638
-1.067
-15.91%
jan 1, 2002
5.116
-0.522
-9.26%
jan 1, 2003
4.947
-0.169
-3.3%
jan 1, 2004
4.564
-0.382
-7.73%
jan 1, 2005
4.538
-0.026
-0.58%
jan 1, 2006
4.009
-0.529
-11.65%
jan 1, 2007
3.537
-0.472
-11.78%
jan 1, 2008
2.926
-0.611
-17.29%
jan 1, 2009
2.613
-0.313
-10.69%
jan 1, 2010
2.322
-0.291
-11.15%
jan 1, 2011
1.938
-0.384
-16.54%
jan 1, 2012
2.021
+0.083
4.27%
jan 1, 2013
1.992
-0.028
-1.39%
jan 1, 2014
1.64
-0.353
-17.7%
Ranking of countries by current statistics by years


Comments: