29
/
en
AIzaSyAYiBZKx7MnpbEhh9jyipgxe19OcubqV5w
April 1, 2024
104759
Chile
CHL
true
2
1
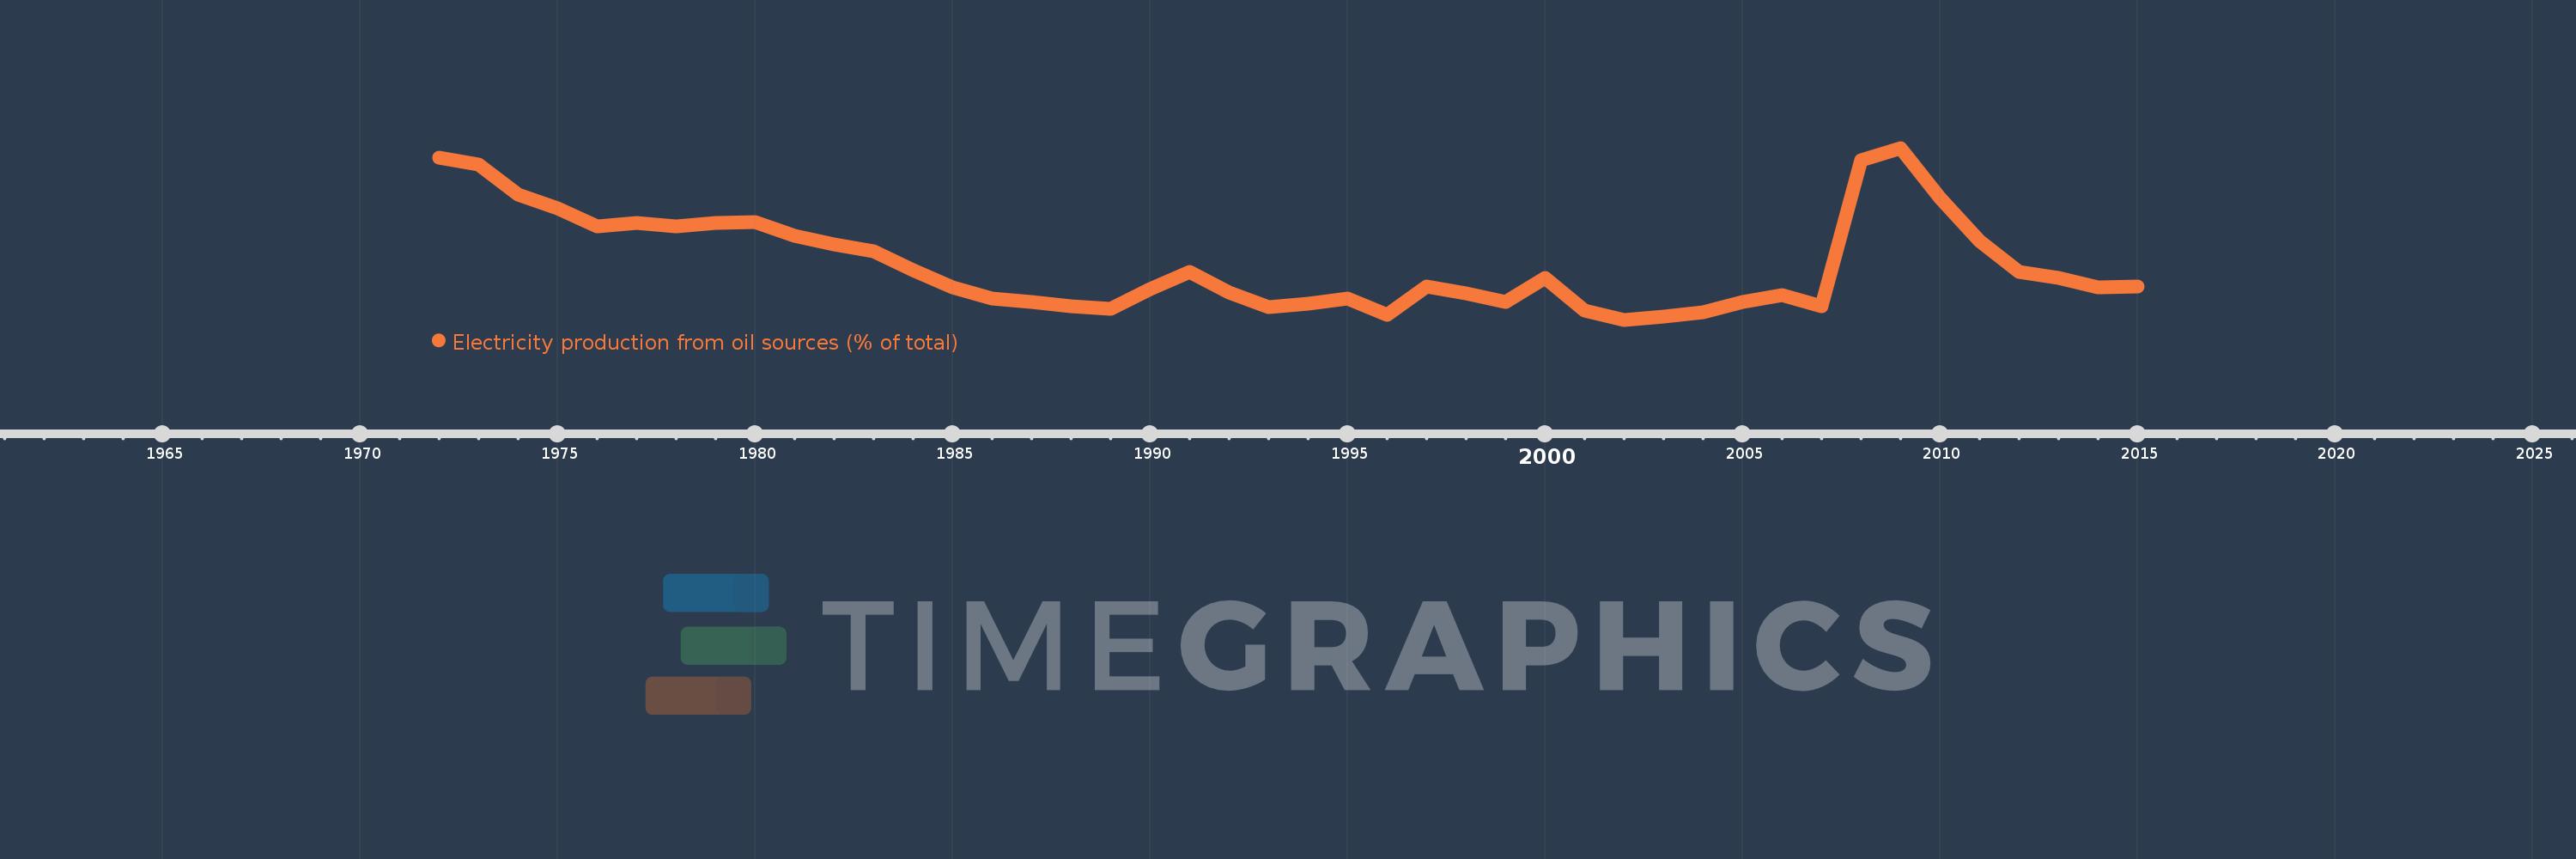
Electricity production from oil sources (% of total)
2015,2014,2013,2012,2011,2010,2009,2008,2007,2006,2005,2004,2003,2002,2001,2000,1999,1998,1997,1996,1995,1994,1993,1992,1991,1990,1989,1988,1987,1986,1985,1984,1983,1982,1981,1980,1979,1978,1977,1976,1975,1974,1973,1972
This statistics in other country:
AlbaniaAlgeriaAngolaArab WorldArgentinaArmeniaAustraliaAustriaAzerbaijanBahrainBangladeshBelarusBelgiumBeninBoliviaBosnia and HerzegovinaBotswanaBrazilBrunei DarussalamBulgariaCambodiaCameroonCanadaCentral Europe and the BalticsChileChinaColombiaCongo, Dem. Rep.Congo, Rep.Costa RicaCote d'IvoireCroatiaCubaCuracaoCyprusCzech RepublicDenmarkDominican RepublicEarly-demographic dividendEast Asia & PacificEast Asia & Pacific (excluding high income)East Asia & Pacific (IDA & IBRD countries)EcuadorEgypt, Arab Rep.El SalvadorEritreaEstoniaEthiopiaEuro areaEurope & Central AsiaEurope & Central Asia (excluding high income)Europe & Central Asia (IDA & IBRD countries)European UnionFinlandFragile and conflict affected situationsFranceGabonGeorgiaGermanyGhanaGibraltarGreeceGuatemalaHaitiHeavily indebted poor countries (HIPC)High incomeHondurasHong Kong SAR, ChinaHungaryIBRD onlyIcelandIDA & IBRD totalIDA blendIDA onlyIDA totalIndiaIndonesiaIran, Islamic Rep.IraqIrelandIsraelItalyJamaicaJapanJordanKazakhstanKenyaKorea, Dem. People’s Rep.Korea, Rep.KosovoKuwaitKyrgyz RepublicLate-demographic dividendLatin America & Caribbean Latin America & Caribbean (excluding high income)Latin America & the Caribbean (IDA & IBRD countries)LatviaLeast developed countries: UN classificationLebanonLibyaLithuaniaLow & middle incomeLower middle incomeLuxembourgMacedonia, FYRMalaysiaMaltaMauritiusMexicoMiddle East & North AfricaMiddle East & North Africa (excluding high income)Middle East & North Africa (IDA & IBRD countries)Middle incomeMoldovaMongoliaMontenegroMoroccoMozambiqueMyanmarNamibiaNepalNetherlandsNew ZealandNicaraguaNigerNigeriaNorth AmericaNorwayOECD membersOmanOther small statesPakistanPanamaParaguayPeruPhilippinesPolandPortugalPost-demographic dividendPre-demographic dividendQatarRomaniaRussian FederationSaudi ArabiaSenegalSerbiaSingaporeSlovak RepublicSloveniaSmall statesSouth AfricaSouth AsiaSouth Asia (IDA & IBRD)South SudanSpainSri LankaSub-Saharan Africa Sub-Saharan Africa (excluding high income)Sub-Saharan Africa (IDA & IBRD countries)SudanSwedenSwitzerlandSyrian Arab RepublicTajikistanTanzaniaThailandTogoTrinidad and TobagoTunisiaTurkeyTurkmenistanUkraineUnited Arab EmiratesUnited KingdomUnited StatesUpper middle incomeUruguayUzbekistanVenezuela, RBVietnamWorldYemen, Rep.ZambiaZimbabwe Timeline:
This timeline shows a graph from 1972 to 2015 of Chile. No data until 1971. Number of actual observations by date: 44.
Source name:
World Development Indicators
Source organization:
IEA Statistics © OECD/IEA 2014 (http://www.iea.org/stats/index.asp), subject to https://www.iea.org/t&c/termsandconditions/
Categories, topics:
Energy & Mining, Climate Change, Infrastructure
Last updated:
apr 23, 2017
Indicators value changes by year
At the date of observation
Value
Absolute change
Change from previous value
jan 1, 1972
25.551
+25.551
0.0%
jan 1, 1973
24.647
-0.904
-3.54%
jan 1, 1974
20.477
-4.171
-16.92%
jan 1, 1975
18.554
-1.922
-9.39%
jan 1, 1976
15.987
-2.567
-13.84%
jan 1, 1977
16.439
+0.451
2.82%
jan 1, 1978
15.988
-0.45
-2.74%
jan 1, 1979
16.438
+0.45
2.82%
jan 1, 1980
16.643
+0.204
1.24%
jan 1, 1981
14.739
-1.904
-11.44%
jan 1, 1982
13.45
-1.29
-8.75%
jan 1, 1983
12.493
-0.957
-7.12%
jan 1, 1984
9.91
-2.583
-20.68%
jan 1, 1985
7.498
-2.412
-24.34%
jan 1, 1986
5.94
-1.558
-20.78%
jan 1, 1987
5.501
-0.44
-7.4%
jan 1, 1988
4.886
-0.615
-11.18%
jan 1, 1989
4.469
-0.416
-8.52%
jan 1, 1990
7.282
+2.813
62.93%
jan 1, 1991
9.623
+2.341
32.15%
jan 1, 1992
6.753
-2.87
-29.83%
jan 1, 1993
4.812
-1.942
-28.75%
jan 1, 1994
5.266
+0.454
9.45%
jan 1, 1995
5.982
+0.716
13.59%
jan 1, 1996
3.714
-2.267
-37.91%
jan 1, 1997
7.64
+3.926
105.69%
jan 1, 1998
6.697
-0.943
-12.34%
jan 1, 1999
5.5
-1.197
-17.88%
jan 1, 2000
8.849
+3.349
60.88%
jan 1, 2001
4.254
-4.594
-51.92%
jan 1, 2002
2.998
-1.256
-29.53%
jan 1, 2003
3.389
+0.391
13.05%
jan 1, 2004
4.03
+0.641
18.9%
jan 1, 2005
5.536
+1.507
37.39%
jan 1, 2006
6.463
+0.927
16.74%
jan 1, 2007
4.91
-1.553
-24.03%
jan 1, 2008
25.27
+20.36
414.7%
jan 1, 2009
26.95
+1.68
6.65%
jan 1, 2010
20.008
-6.942
-25.76%
jan 1, 2011
14.015
-5.992
-29.95%
jan 1, 2012
9.671
-4.344
-31.0%
jan 1, 2013
8.808
-0.862
-8.92%
jan 1, 2014
7.46
-1.348
-15.3%
jan 1, 2015
7.629
+0.169
2.26%
Ranking of countries by current statistics by years


Comments: