29
/
en
AIzaSyAYiBZKx7MnpbEhh9jyipgxe19OcubqV5w
April 1, 2024
169232
Korea, Dem. People’s Rep.
PRK
true
2
1
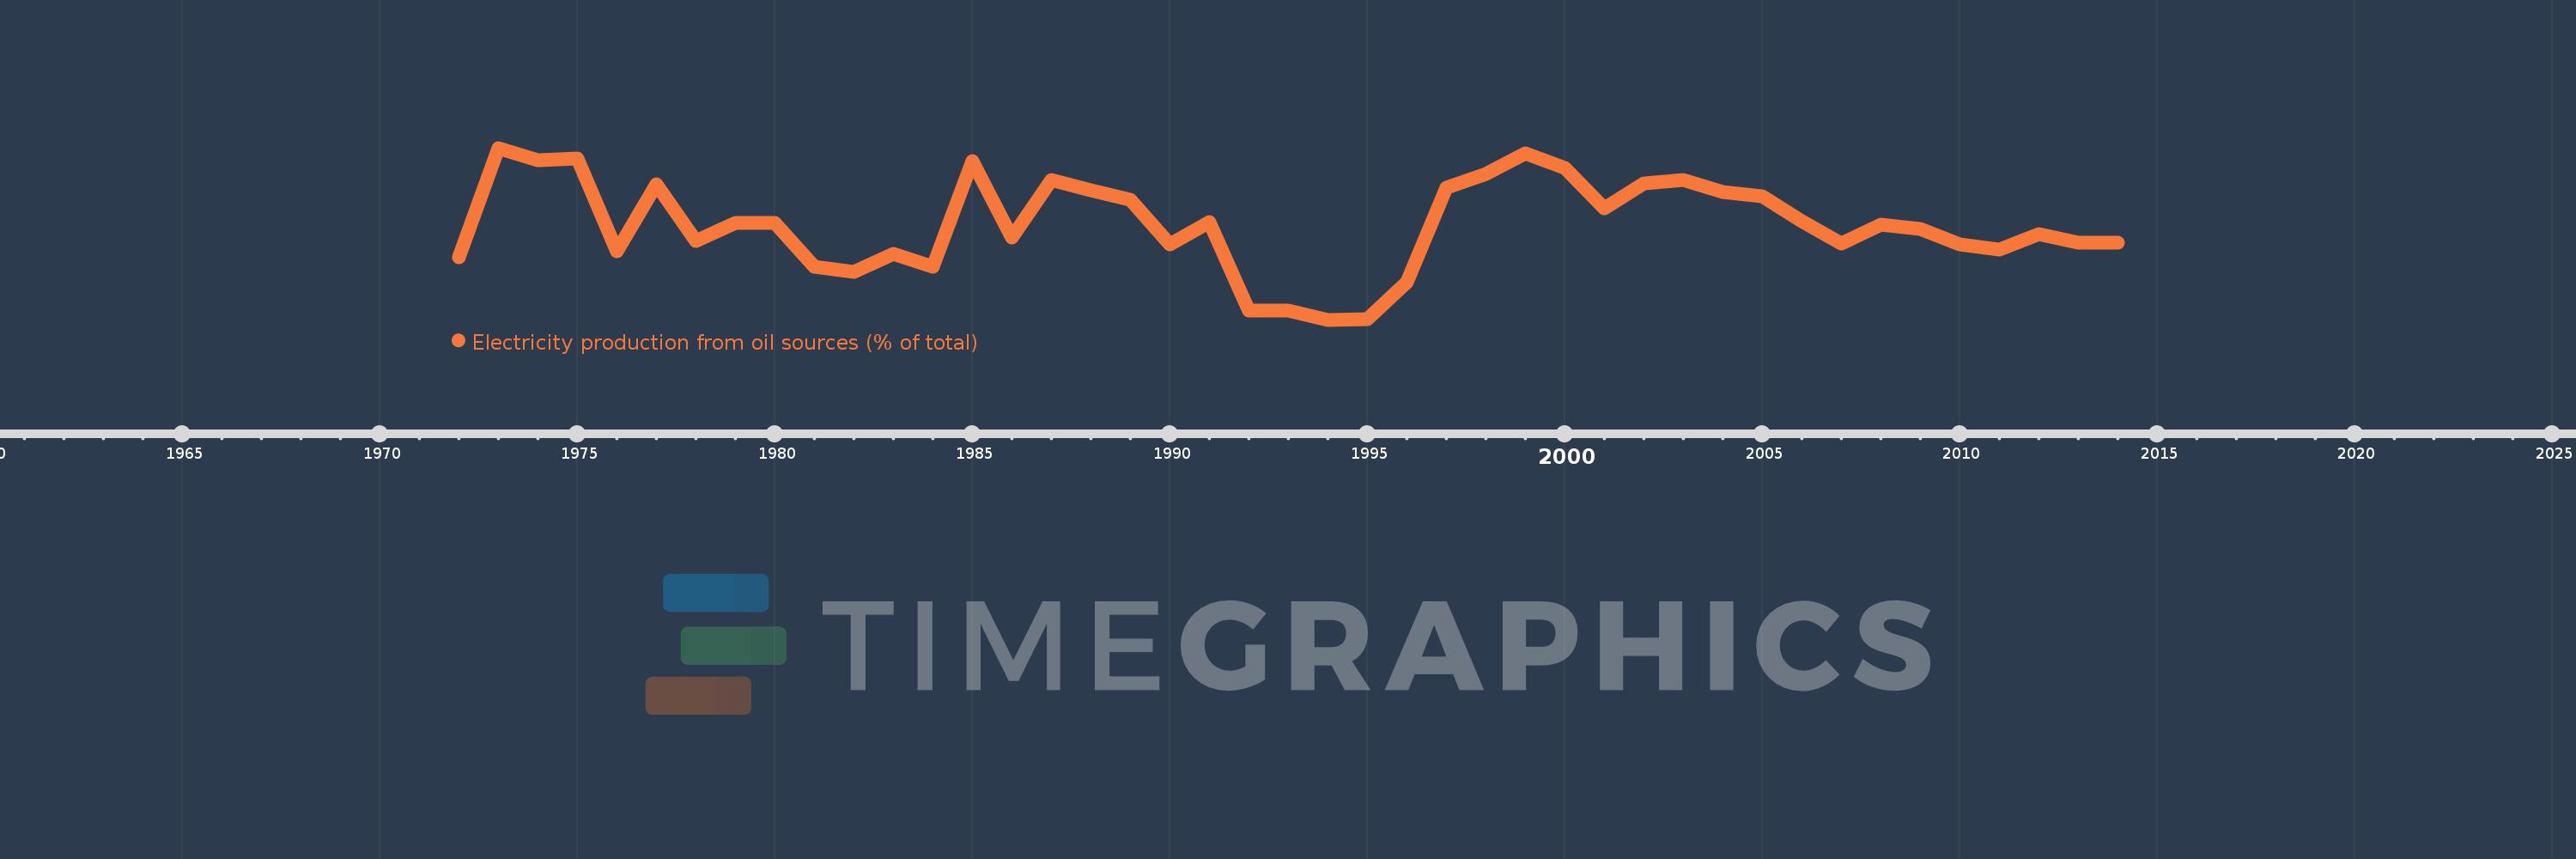
Electricity production from oil sources (% of total)
2014,2013,2012,2011,2010,2009,2008,2007,2006,2005,2004,2003,2002,2001,2000,1999,1998,1997,1996,1995,1994,1993,1992,1991,1990,1989,1988,1987,1986,1985,1984,1983,1982,1981,1980,1979,1978,1977,1976,1975,1974,1973,1972
This statistics in other country:
AlbaniaAlgeriaAngolaArab WorldArgentinaArmeniaAustraliaAustriaAzerbaijanBahrainBangladeshBelarusBelgiumBeninBoliviaBosnia and HerzegovinaBotswanaBrazilBrunei DarussalamBulgariaCambodiaCameroonCanadaCentral Europe and the BalticsChileChinaColombiaCongo, Dem. Rep.Congo, Rep.Costa RicaCote d'IvoireCroatiaCubaCuracaoCyprusCzech RepublicDenmarkDominican RepublicEarly-demographic dividendEast Asia & PacificEast Asia & Pacific (excluding high income)East Asia & Pacific (IDA & IBRD countries)EcuadorEgypt, Arab Rep.El SalvadorEritreaEstoniaEthiopiaEuro areaEurope & Central AsiaEurope & Central Asia (excluding high income)Europe & Central Asia (IDA & IBRD countries)European UnionFinlandFragile and conflict affected situationsFranceGabonGeorgiaGermanyGhanaGibraltarGreeceGuatemalaHaitiHeavily indebted poor countries (HIPC)High incomeHondurasHong Kong SAR, ChinaHungaryIBRD onlyIcelandIDA & IBRD totalIDA blendIDA onlyIDA totalIndiaIndonesiaIran, Islamic Rep.IraqIrelandIsraelItalyJamaicaJapanJordanKazakhstanKenyaKorea, Dem. People’s Rep.Korea, Rep.KosovoKuwaitKyrgyz RepublicLate-demographic dividendLatin America & Caribbean Latin America & Caribbean (excluding high income)Latin America & the Caribbean (IDA & IBRD countries)LatviaLeast developed countries: UN classificationLebanonLibyaLithuaniaLow & middle incomeLower middle incomeLuxembourgMacedonia, FYRMalaysiaMaltaMauritiusMexicoMiddle East & North AfricaMiddle East & North Africa (excluding high income)Middle East & North Africa (IDA & IBRD countries)Middle incomeMoldovaMongoliaMontenegroMoroccoMozambiqueMyanmarNamibiaNepalNetherlandsNew ZealandNicaraguaNigerNigeriaNorth AmericaNorwayOECD membersOmanOther small statesPakistanPanamaParaguayPeruPhilippinesPolandPortugalPost-demographic dividendPre-demographic dividendQatarRomaniaRussian FederationSaudi ArabiaSenegalSerbiaSingaporeSlovak RepublicSloveniaSmall statesSouth AfricaSouth AsiaSouth Asia (IDA & IBRD)South SudanSpainSri LankaSub-Saharan Africa Sub-Saharan Africa (excluding high income)Sub-Saharan Africa (IDA & IBRD countries)SudanSwedenSwitzerlandSyrian Arab RepublicTajikistanTanzaniaThailandTogoTrinidad and TobagoTunisiaTurkeyTurkmenistanUkraineUnited Arab EmiratesUnited KingdomUnited StatesUpper middle incomeUruguayUzbekistanVenezuela, RBVietnamWorldYemen, Rep.ZambiaZimbabwe Timeline:
This timeline shows a graph from 1972 to 2014 of Korea, Dem. People’s Rep.. No data until 1971. Number of actual observations by date: 43.
Source name:
World Development Indicators
Source organization:
IEA Statistics © OECD/IEA 2014 (http://www.iea.org/stats/index.asp), subject to https://www.iea.org/t&c/termsandconditions/
Categories, topics:
Energy & Mining, Climate Change, Infrastructure
Last updated:
apr 23, 2017
Indicators value changes by year
At the date of observation
Value
Absolute change
Change from previous value
jan 1, 1972
2.376
+2.376
0.0%
jan 1, 1973
6.266
+3.89
163.77%
jan 1, 1974
5.82
-0.446
-7.11%
jan 1, 1975
5.883
+0.063
1.08%
jan 1, 1976
2.579
-3.304
-56.16%
jan 1, 1977
4.958
+2.378
92.21%
jan 1, 1978
2.929
-2.029
-40.92%
jan 1, 1979
3.593
+0.664
22.66%
jan 1, 1980
3.589
-0.004
-0.11%
jan 1, 1981
2.014
-1.575
-43.88%
jan 1, 1982
1.832
-0.182
-9.05%
jan 1, 1983
2.482
+0.65
35.49%
jan 1, 1984
2.01
-0.473
-19.04%
jan 1, 1985
5.808
+3.798
189.01%
jan 1, 1986
3.06
-2.748
-47.32%
jan 1, 1987
5.126
+2.067
67.55%
jan 1, 1988
4.755
-0.372
-7.25%
jan 1, 1989
4.416
-0.339
-7.13%
jan 1, 1990
2.815
-1.601
-36.25%
jan 1, 1991
3.632
+0.817
29.01%
jan 1, 1992
0.468
-3.164
-87.12%
jan 1, 1993
0.453
-0.014
-3.04%
jan 1, 1994
0.131
-0.322
-71.06%
jan 1, 1995
0.139
+0.007
5.57%
jan 1, 1996
1.457
+1.318
951.43%
jan 1, 1997
4.845
+3.389
232.65%
jan 1, 1998
5.347
+0.502
10.36%
jan 1, 1999
6.071
+0.723
13.53%
jan 1, 2000
5.548
-0.522
-8.6%
jan 1, 2001
4.108
-1.44
-25.96%
jan 1, 2002
5.01
+0.902
21.95%
jan 1, 2003
5.127
+0.118
2.35%
jan 1, 2004
4.7
-0.427
-8.33%
jan 1, 2005
4.533
-0.168
-3.57%
jan 1, 2006
3.644
-0.888
-19.6%
jan 1, 2007
2.848
-0.796
-21.85%
jan 1, 2008
3.54
+0.692
24.3%
jan 1, 2009
3.37
-0.17
-4.81%
jan 1, 2010
2.821
-0.549
-16.29%
jan 1, 2011
2.631
-0.19
-6.73%
jan 1, 2012
3.204
+0.573
21.77%
jan 1, 2013
2.87
-0.334
-10.44%
jan 1, 2014
2.873
+0.004
0.13%
Ranking of countries by current statistics by years


Comments: