29
/
en
AIzaSyAYiBZKx7MnpbEhh9jyipgxe19OcubqV5w
April 1, 2024
32522
Europe & Central Asia (IDA & IBRD countries)
TEC
false
2
1
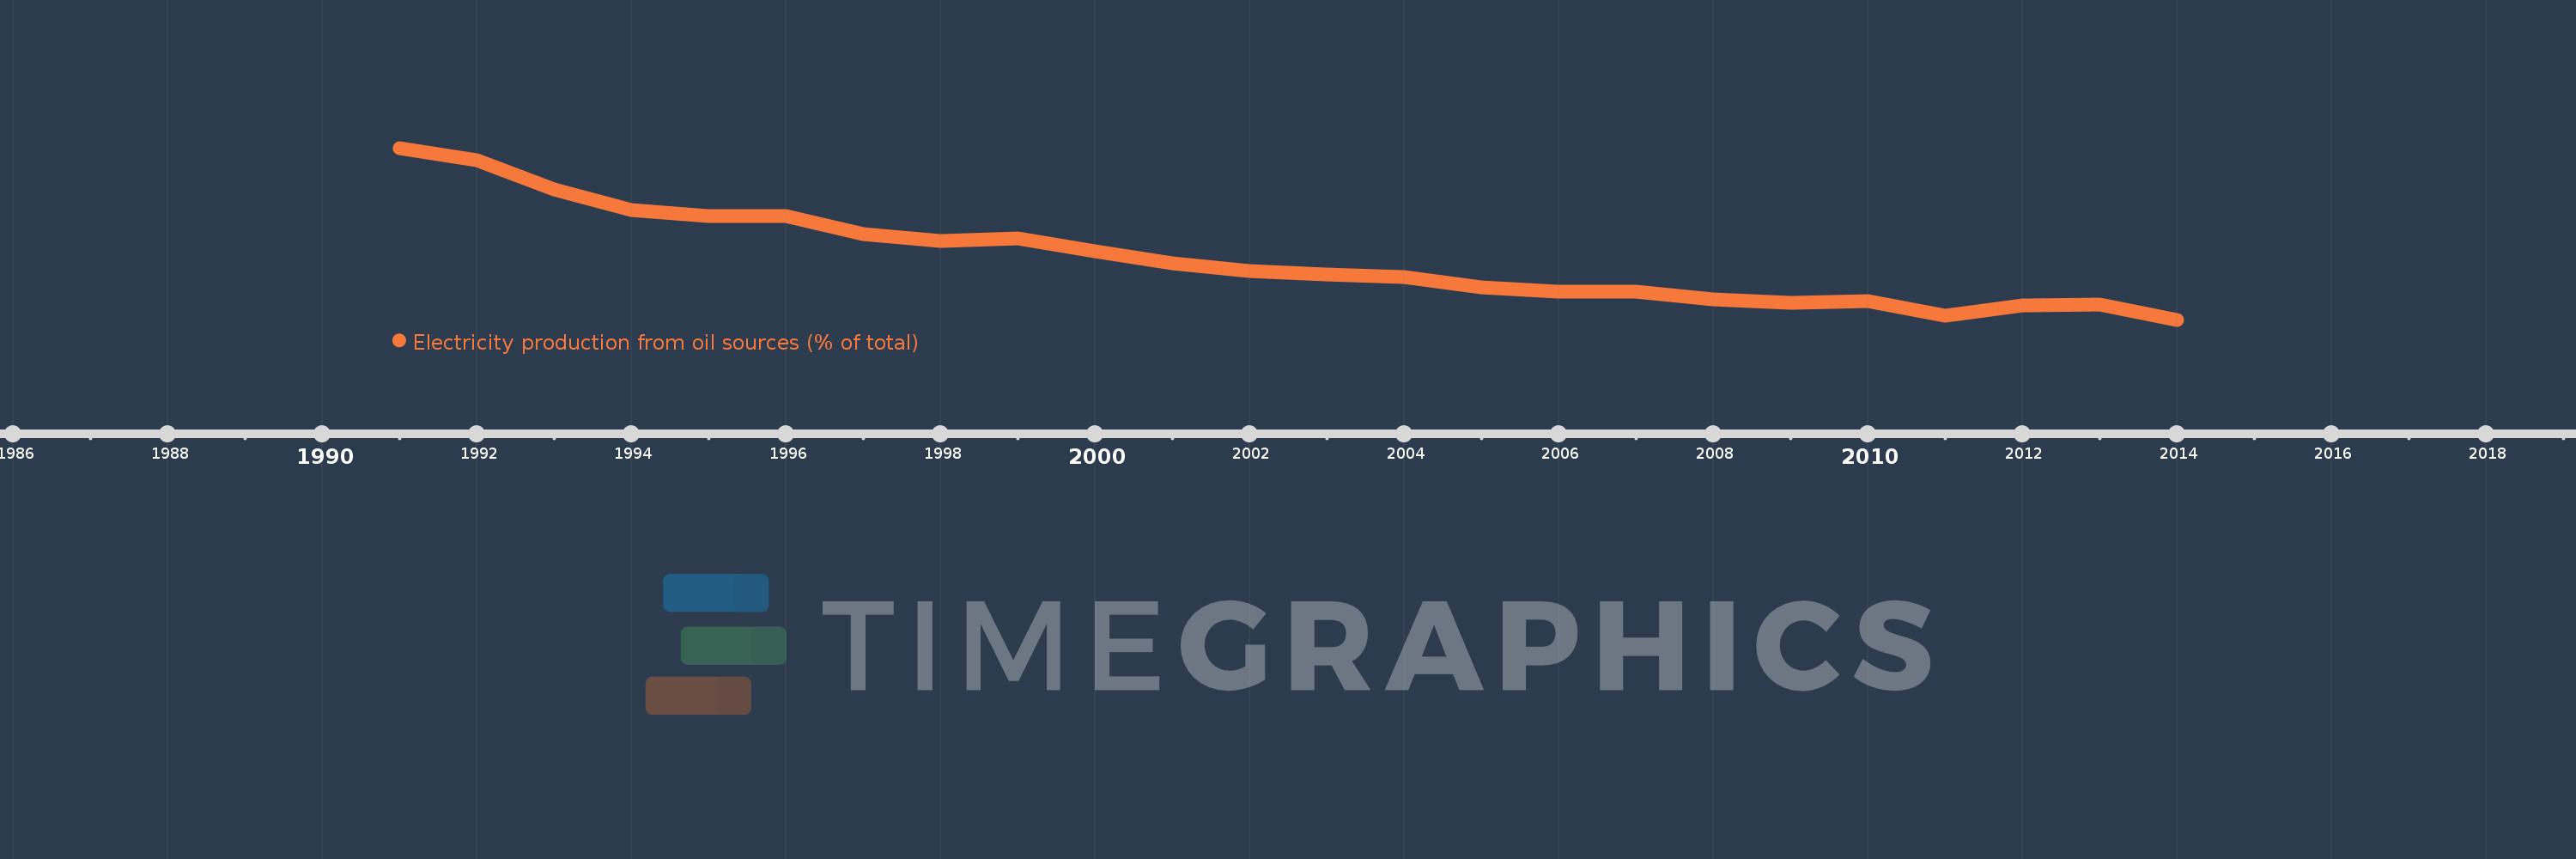
Electricity production from oil sources (% of total)
2014,2013,2012,2011,2010,2009,2008,2007,2006,2005,2004,2003,2002,2001,2000,1999,1998,1997,1996,1995,1994,1993,1992,1991
This statistics in other country:
AlbaniaAlgeriaAngolaArab WorldArgentinaArmeniaAustraliaAustriaAzerbaijanBahrainBangladeshBelarusBelgiumBeninBoliviaBosnia and HerzegovinaBotswanaBrazilBrunei DarussalamBulgariaCambodiaCameroonCanadaCentral Europe and the BalticsChileChinaColombiaCongo, Dem. Rep.Congo, Rep.Costa RicaCote d'IvoireCroatiaCubaCuracaoCyprusCzech RepublicDenmarkDominican RepublicEarly-demographic dividendEast Asia & PacificEast Asia & Pacific (excluding high income)East Asia & Pacific (IDA & IBRD countries)EcuadorEgypt, Arab Rep.El SalvadorEritreaEstoniaEthiopiaEuro areaEurope & Central AsiaEurope & Central Asia (excluding high income)Europe & Central Asia (IDA & IBRD countries)European UnionFinlandFragile and conflict affected situationsFranceGabonGeorgiaGermanyGhanaGibraltarGreeceGuatemalaHaitiHeavily indebted poor countries (HIPC)High incomeHondurasHong Kong SAR, ChinaHungaryIBRD onlyIcelandIDA & IBRD totalIDA blendIDA onlyIDA totalIndiaIndonesiaIran, Islamic Rep.IraqIrelandIsraelItalyJamaicaJapanJordanKazakhstanKenyaKorea, Dem. People’s Rep.Korea, Rep.KosovoKuwaitKyrgyz RepublicLate-demographic dividendLatin America & Caribbean Latin America & Caribbean (excluding high income)Latin America & the Caribbean (IDA & IBRD countries)LatviaLeast developed countries: UN classificationLebanonLibyaLithuaniaLow & middle incomeLower middle incomeLuxembourgMacedonia, FYRMalaysiaMaltaMauritiusMexicoMiddle East & North AfricaMiddle East & North Africa (excluding high income)Middle East & North Africa (IDA & IBRD countries)Middle incomeMoldovaMongoliaMontenegroMoroccoMozambiqueMyanmarNamibiaNepalNetherlandsNew ZealandNicaraguaNigerNigeriaNorth AmericaNorwayOECD membersOmanOther small statesPakistanPanamaParaguayPeruPhilippinesPolandPortugalPost-demographic dividendPre-demographic dividendQatarRomaniaRussian FederationSaudi ArabiaSenegalSerbiaSingaporeSlovak RepublicSloveniaSmall statesSouth AfricaSouth AsiaSouth Asia (IDA & IBRD)South SudanSpainSri LankaSub-Saharan Africa Sub-Saharan Africa (excluding high income)Sub-Saharan Africa (IDA & IBRD countries)SudanSwedenSwitzerlandSyrian Arab RepublicTajikistanTanzaniaThailandTogoTrinidad and TobagoTunisiaTurkeyTurkmenistanUkraineUnited Arab EmiratesUnited KingdomUnited StatesUpper middle incomeUruguayUzbekistanVenezuela, RBVietnamWorldYemen, Rep.ZambiaZimbabwe Timeline:
This timeline shows a graph from 1991 to 2014 of Europe & Central Asia (IDA & IBRD countries). No data until 1990. Number of actual observations by date: 24.
Source name:
World Development Indicators
Source organization:
IEA Statistics © OECD/IEA 2014 (http://www.iea.org/stats/index.asp), subject to https://www.iea.org/t&c/termsandconditions/
Categories, topics:
Energy & Mining, Climate Change, Infrastructure
Last updated:
apr 23, 2017
Indicators value changes by year
Maximum:
12.197
jan 1, 1991
At the date of observation
Value
Absolute change
Change from previous value
jan 1, 1991
12.197
+12.197
0.0%
jan 1, 1992
11.362
-0.836
-6.85%
jan 1, 1993
9.394
-1.967
-17.32%
jan 1, 1994
8.047
-1.348
-14.35%
jan 1, 1995
7.661
-0.386
-4.8%
jan 1, 1996
7.622
-0.039
-0.5%
jan 1, 1997
6.431
-1.192
-15.63%
jan 1, 1998
5.975
-0.455
-7.08%
jan 1, 1999
6.142
+0.167
2.79%
jan 1, 2000
5.269
-0.872
-14.21%
jan 1, 2001
4.456
-0.813
-15.44%
jan 1, 2002
3.968
-0.488
-10.95%
jan 1, 2003
3.711
-0.257
-6.47%
jan 1, 2004
3.548
-0.163
-4.4%
jan 1, 2005
2.878
-0.67
-18.87%
jan 1, 2006
2.566
-0.313
-10.86%
jan 1, 2007
2.576
+0.01
0.39%
jan 1, 2008
2.084
-0.492
-19.08%
jan 1, 2009
1.858
-0.226
-10.83%
jan 1, 2010
1.927
+0.069
3.71%
jan 1, 2011
0.956
-0.971
-50.4%
jan 1, 2012
1.677
+0.721
75.47%
jan 1, 2013
1.721
+0.044
2.63%
jan 1, 2014
0.705
-1.017
-59.06%
Ranking of countries by current statistics by years


Comments: