29
/
en
AIzaSyAYiBZKx7MnpbEhh9jyipgxe19OcubqV5w
April 1, 2024
78120
Bangladesh
BGD
true
2
1
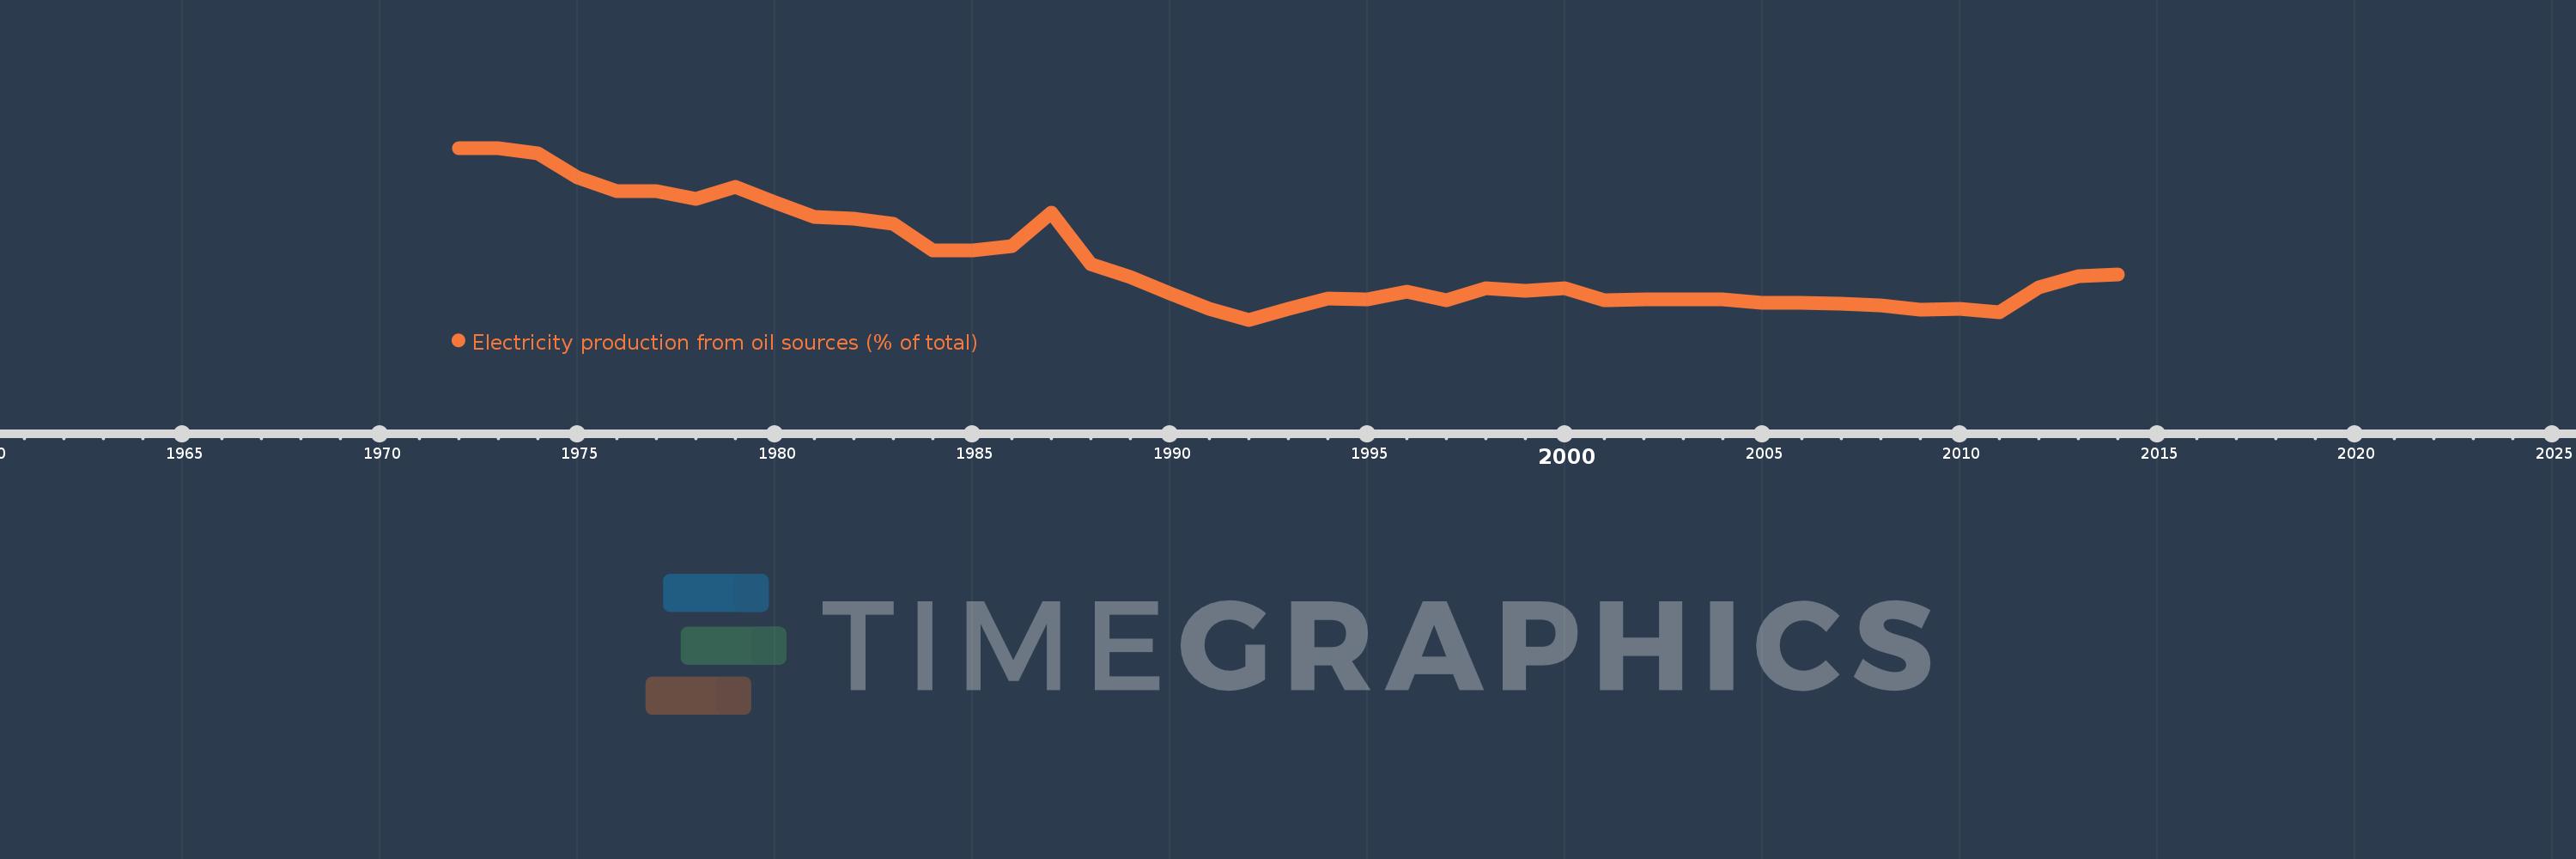
Electricity production from oil sources (% of total)
2014,2013,2012,2011,2010,2009,2008,2007,2006,2005,2004,2003,2002,2001,2000,1999,1998,1997,1996,1995,1994,1993,1992,1991,1990,1989,1988,1987,1986,1985,1984,1983,1982,1981,1980,1979,1978,1977,1976,1975,1974,1973,1972
This statistics in other country:
AlbaniaAlgeriaAngolaArab WorldArgentinaArmeniaAustraliaAustriaAzerbaijanBahrainBangladeshBelarusBelgiumBeninBoliviaBosnia and HerzegovinaBotswanaBrazilBrunei DarussalamBulgariaCambodiaCameroonCanadaCentral Europe and the BalticsChileChinaColombiaCongo, Dem. Rep.Congo, Rep.Costa RicaCote d'IvoireCroatiaCubaCuracaoCyprusCzech RepublicDenmarkDominican RepublicEarly-demographic dividendEast Asia & PacificEast Asia & Pacific (excluding high income)East Asia & Pacific (IDA & IBRD countries)EcuadorEgypt, Arab Rep.El SalvadorEritreaEstoniaEthiopiaEuro areaEurope & Central AsiaEurope & Central Asia (excluding high income)Europe & Central Asia (IDA & IBRD countries)European UnionFinlandFragile and conflict affected situationsFranceGabonGeorgiaGermanyGhanaGibraltarGreeceGuatemalaHaitiHeavily indebted poor countries (HIPC)High incomeHondurasHong Kong SAR, ChinaHungaryIBRD onlyIcelandIDA & IBRD totalIDA blendIDA onlyIDA totalIndiaIndonesiaIran, Islamic Rep.IraqIrelandIsraelItalyJamaicaJapanJordanKazakhstanKenyaKorea, Dem. People’s Rep.Korea, Rep.KosovoKuwaitKyrgyz RepublicLate-demographic dividendLatin America & Caribbean Latin America & Caribbean (excluding high income)Latin America & the Caribbean (IDA & IBRD countries)LatviaLeast developed countries: UN classificationLebanonLibyaLithuaniaLow & middle incomeLower middle incomeLuxembourgMacedonia, FYRMalaysiaMaltaMauritiusMexicoMiddle East & North AfricaMiddle East & North Africa (excluding high income)Middle East & North Africa (IDA & IBRD countries)Middle incomeMoldovaMongoliaMontenegroMoroccoMozambiqueMyanmarNamibiaNepalNetherlandsNew ZealandNicaraguaNigerNigeriaNorth AmericaNorwayOECD membersOmanOther small statesPakistanPanamaParaguayPeruPhilippinesPolandPortugalPost-demographic dividendPre-demographic dividendQatarRomaniaRussian FederationSaudi ArabiaSenegalSerbiaSingaporeSlovak RepublicSloveniaSmall statesSouth AfricaSouth AsiaSouth Asia (IDA & IBRD)South SudanSpainSri LankaSub-Saharan Africa Sub-Saharan Africa (excluding high income)Sub-Saharan Africa (IDA & IBRD countries)SudanSwedenSwitzerlandSyrian Arab RepublicTajikistanTanzaniaThailandTogoTrinidad and TobagoTunisiaTurkeyTurkmenistanUkraineUnited Arab EmiratesUnited KingdomUnited StatesUpper middle incomeUruguayUzbekistanVenezuela, RBVietnamWorldYemen, Rep.ZambiaZimbabwe Timeline:
This timeline shows a graph from 1972 to 2014 of Bangladesh. No data until 1971. Number of actual observations by date: 43.
Source name:
World Development Indicators
Source organization:
IEA Statistics © OECD/IEA 2014 (http://www.iea.org/stats/index.asp), subject to https://www.iea.org/t&c/termsandconditions/
Categories, topics:
Energy & Mining, Climate Change, Infrastructure
Last updated:
apr 23, 2017
Indicators value changes by year
Maximum:
43.107
jan 1, 1972
At the date of observation
Value
Absolute change
Change from previous value
jan 1, 1972
43.107
+43.107
0.0%
jan 1, 1973
43.107
0.0
0.0%
jan 1, 1974
41.738
-1.369
-3.18%
jan 1, 1975
35.959
-5.779
-13.85%
jan 1, 1976
32.637
-3.322
-9.24%
jan 1, 1977
32.787
+0.15
0.46%
jan 1, 1978
30.869
-1.918
-5.85%
jan 1, 1979
33.844
+2.975
9.64%
jan 1, 1980
29.933
-3.911
-11.56%
jan 1, 1981
26.604
-3.329
-11.12%
jan 1, 1982
26.071
-0.534
-2.01%
jan 1, 1983
24.868
-1.202
-4.61%
jan 1, 1984
18.41
-6.459
-25.97%
jan 1, 1985
18.533
+0.123
0.67%
jan 1, 1986
19.435
+0.902
4.87%
jan 1, 1987
27.458
+8.024
41.29%
jan 1, 1988
15.053
-12.406
-45.18%
jan 1, 1989
12.093
-2.96
-19.66%
jan 1, 1990
8.194
-3.899
-32.24%
jan 1, 1991
4.307
-3.887
-47.44%
jan 1, 1992
1.765
-2.541
-59.01%
jan 1, 1993
4.452
+2.687
152.2%
jan 1, 1994
6.789
+2.337
52.48%
jan 1, 1995
6.705
-0.084
-1.24%
jan 1, 1996
8.532
+1.827
27.26%
jan 1, 1997
6.458
-2.074
-24.31%
jan 1, 1998
9.428
+2.97
45.99%
jan 1, 1999
8.702
-0.726
-7.7%
jan 1, 2000
9.266
+0.564
6.49%
jan 1, 2001
6.449
-2.818
-30.41%
jan 1, 2002
6.739
+0.29
4.5%
jan 1, 2003
6.74
+0.001
0.02%
jan 1, 2004
6.742
+0.002
0.03%
jan 1, 2005
5.862
-0.88
-13.05%
jan 1, 2006
5.77
-0.092
-1.57%
jan 1, 2007
5.553
-0.217
-3.75%
jan 1, 2008
5.299
-0.254
-4.58%
jan 1, 2009
4.197
-1.103
-20.81%
jan 1, 2010
4.325
+0.129
3.07%
jan 1, 2011
3.623
-0.702
-16.23%
jan 1, 2012
9.492
+5.869
161.96%
jan 1, 2013
12.337
+2.845
29.97%
jan 1, 2014
12.616
+0.279
2.26%
Ranking of countries by current statistics by years


Comments: