29
/
en
AIzaSyAYiBZKx7MnpbEhh9jyipgxe19OcubqV5w
April 1, 2024
24024
Arab World
ARB
false
2
1
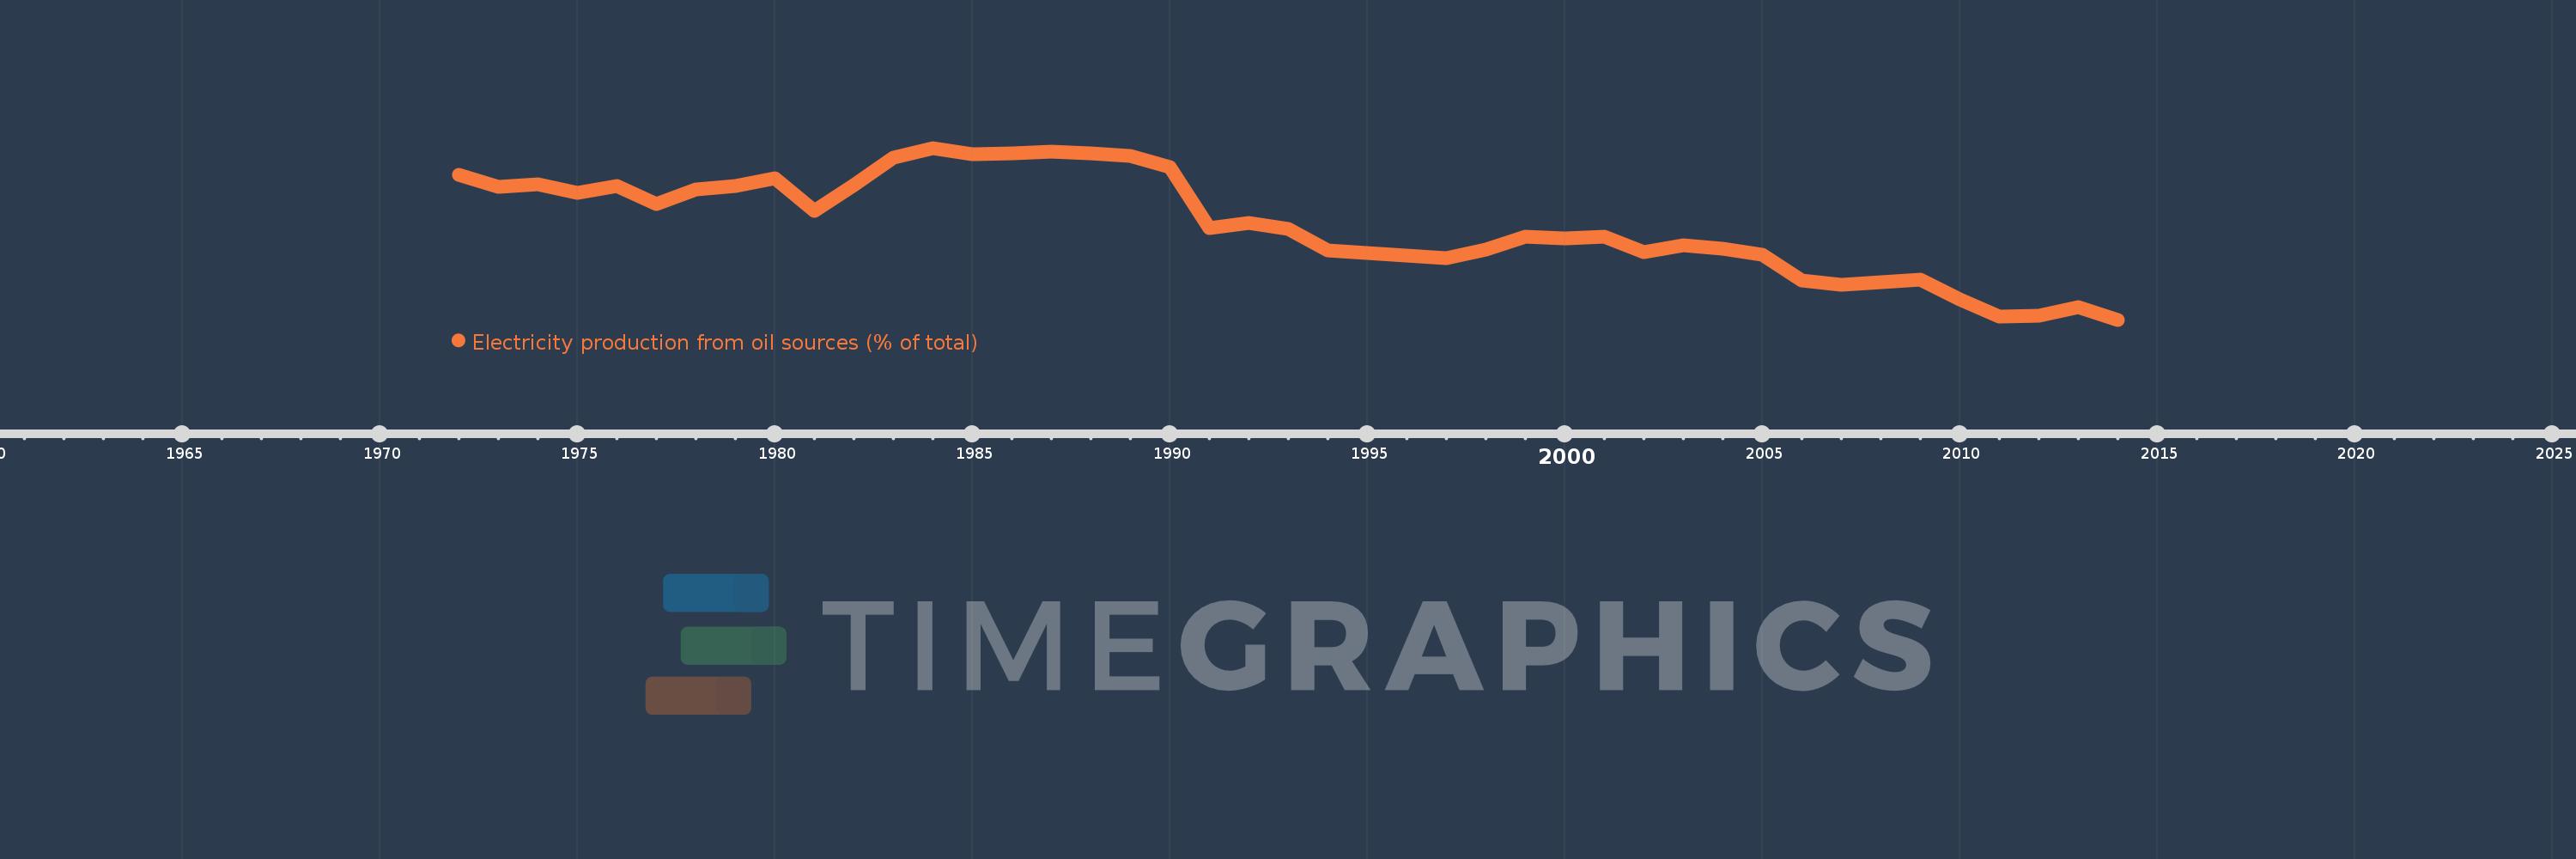
Electricity production from oil sources (% of total)
2014,2013,2012,2011,2010,2009,2008,2007,2006,2005,2004,2003,2002,2001,2000,1999,1998,1997,1996,1995,1994,1993,1992,1991,1990,1989,1988,1987,1986,1985,1984,1983,1982,1981,1980,1979,1978,1977,1976,1975,1974,1973,1972
This statistics in other country:
AlbaniaAlgeriaAngolaArab WorldArgentinaArmeniaAustraliaAustriaAzerbaijanBahrainBangladeshBelarusBelgiumBeninBoliviaBosnia and HerzegovinaBotswanaBrazilBrunei DarussalamBulgariaCambodiaCameroonCanadaCentral Europe and the BalticsChileChinaColombiaCongo, Dem. Rep.Congo, Rep.Costa RicaCote d'IvoireCroatiaCubaCuracaoCyprusCzech RepublicDenmarkDominican RepublicEarly-demographic dividendEast Asia & PacificEast Asia & Pacific (excluding high income)East Asia & Pacific (IDA & IBRD countries)EcuadorEgypt, Arab Rep.El SalvadorEritreaEstoniaEthiopiaEuro areaEurope & Central AsiaEurope & Central Asia (excluding high income)Europe & Central Asia (IDA & IBRD countries)European UnionFinlandFragile and conflict affected situationsFranceGabonGeorgiaGermanyGhanaGibraltarGreeceGuatemalaHaitiHeavily indebted poor countries (HIPC)High incomeHondurasHong Kong SAR, ChinaHungaryIBRD onlyIcelandIDA & IBRD totalIDA blendIDA onlyIDA totalIndiaIndonesiaIran, Islamic Rep.IraqIrelandIsraelItalyJamaicaJapanJordanKazakhstanKenyaKorea, Dem. People’s Rep.Korea, Rep.KosovoKuwaitKyrgyz RepublicLate-demographic dividendLatin America & Caribbean Latin America & Caribbean (excluding high income)Latin America & the Caribbean (IDA & IBRD countries)LatviaLeast developed countries: UN classificationLebanonLibyaLithuaniaLow & middle incomeLower middle incomeLuxembourgMacedonia, FYRMalaysiaMaltaMauritiusMexicoMiddle East & North AfricaMiddle East & North Africa (excluding high income)Middle East & North Africa (IDA & IBRD countries)Middle incomeMoldovaMongoliaMontenegroMoroccoMozambiqueMyanmarNamibiaNepalNetherlandsNew ZealandNicaraguaNigerNigeriaNorth AmericaNorwayOECD membersOmanOther small statesPakistanPanamaParaguayPeruPhilippinesPolandPortugalPost-demographic dividendPre-demographic dividendQatarRomaniaRussian FederationSaudi ArabiaSenegalSerbiaSingaporeSlovak RepublicSloveniaSmall statesSouth AfricaSouth AsiaSouth Asia (IDA & IBRD)South SudanSpainSri LankaSub-Saharan Africa Sub-Saharan Africa (excluding high income)Sub-Saharan Africa (IDA & IBRD countries)SudanSwedenSwitzerlandSyrian Arab RepublicTajikistanTanzaniaThailandTogoTrinidad and TobagoTunisiaTurkeyTurkmenistanUkraineUnited Arab EmiratesUnited KingdomUnited StatesUpper middle incomeUruguayUzbekistanVenezuela, RBVietnamWorldYemen, Rep.ZambiaZimbabwe Timeline:
This timeline shows a graph from 1972 to 2014 of Arab World. No data until 1971. Number of actual observations by date: 43.
Source name:
World Development Indicators
Source organization:
IEA Statistics © OECD/IEA 2014 (http://www.iea.org/stats/index.asp), subject to https://www.iea.org/t&c/termsandconditions/
Categories, topics:
Energy & Mining, Climate Change, Infrastructure
Last updated:
apr 23, 2017
Indicators value changes by year
Minimum:
21.242
jan 1, 2014
Maximum:
48.738
jan 1, 1984
At the date of observation
Value
Absolute change
Change from previous value
jan 1, 1972
44.45
+44.45
0.0%
jan 1, 1973
42.448
-2.003
-4.51%
jan 1, 1974
42.959
+0.511
1.2%
jan 1, 1975
41.532
-1.428
-3.32%
jan 1, 1976
42.649
+1.117
2.69%
jan 1, 1977
39.827
-2.822
-6.62%
jan 1, 1978
42.12
+2.293
5.76%
jan 1, 1979
42.587
+0.467
1.11%
jan 1, 1980
43.857
+1.271
2.98%
jan 1, 1981
38.628
-5.23
-11.92%
jan 1, 1982
42.771
+4.143
10.73%
jan 1, 1983
47.248
+4.477
10.47%
jan 1, 1984
48.738
+1.49
3.15%
jan 1, 1985
47.755
-0.983
-2.02%
jan 1, 1986
47.841
+0.086
0.18%
jan 1, 1987
48.103
+0.262
0.55%
jan 1, 1988
47.926
-0.177
-0.37%
jan 1, 1989
47.517
-0.409
-0.85%
jan 1, 1990
45.68
-1.837
-3.87%
jan 1, 1991
35.928
-9.752
-21.35%
jan 1, 1992
36.722
+0.794
2.21%
jan 1, 1993
35.836
-0.886
-2.41%
jan 1, 1994
32.38
-3.456
-9.64%
jan 1, 1995
31.977
-0.404
-1.25%
jan 1, 1996
31.526
-0.451
-1.41%
jan 1, 1997
31.04
-0.485
-1.54%
jan 1, 1998
32.447
+1.407
4.53%
jan 1, 1999
34.491
+2.043
6.3%
jan 1, 2000
34.246
-0.245
-0.71%
jan 1, 2001
34.524
+0.278
0.81%
jan 1, 2002
31.997
-2.526
-7.32%
jan 1, 2003
33.194
+1.196
3.74%
jan 1, 2004
32.607
-0.586
-1.77%
jan 1, 2005
31.634
-0.973
-2.98%
jan 1, 2006
27.577
-4.057
-12.82%
jan 1, 2007
26.817
-0.76
-2.75%
jan 1, 2008
27.265
+0.448
1.67%
jan 1, 2009
27.67
+0.405
1.48%
jan 1, 2010
24.55
-3.12
-11.28%
jan 1, 2011
21.805
-2.744
-11.18%
jan 1, 2012
21.85
+0.045
0.21%
jan 1, 2013
23.27
+1.42
6.5%
jan 1, 2014
21.242
-2.028
-8.71%
Ranking of countries by current statistics by years


Comments: