29
/
en
AIzaSyAYiBZKx7MnpbEhh9jyipgxe19OcubqV5w
April 1, 2024
215172
Oman
OMN
true
2
1
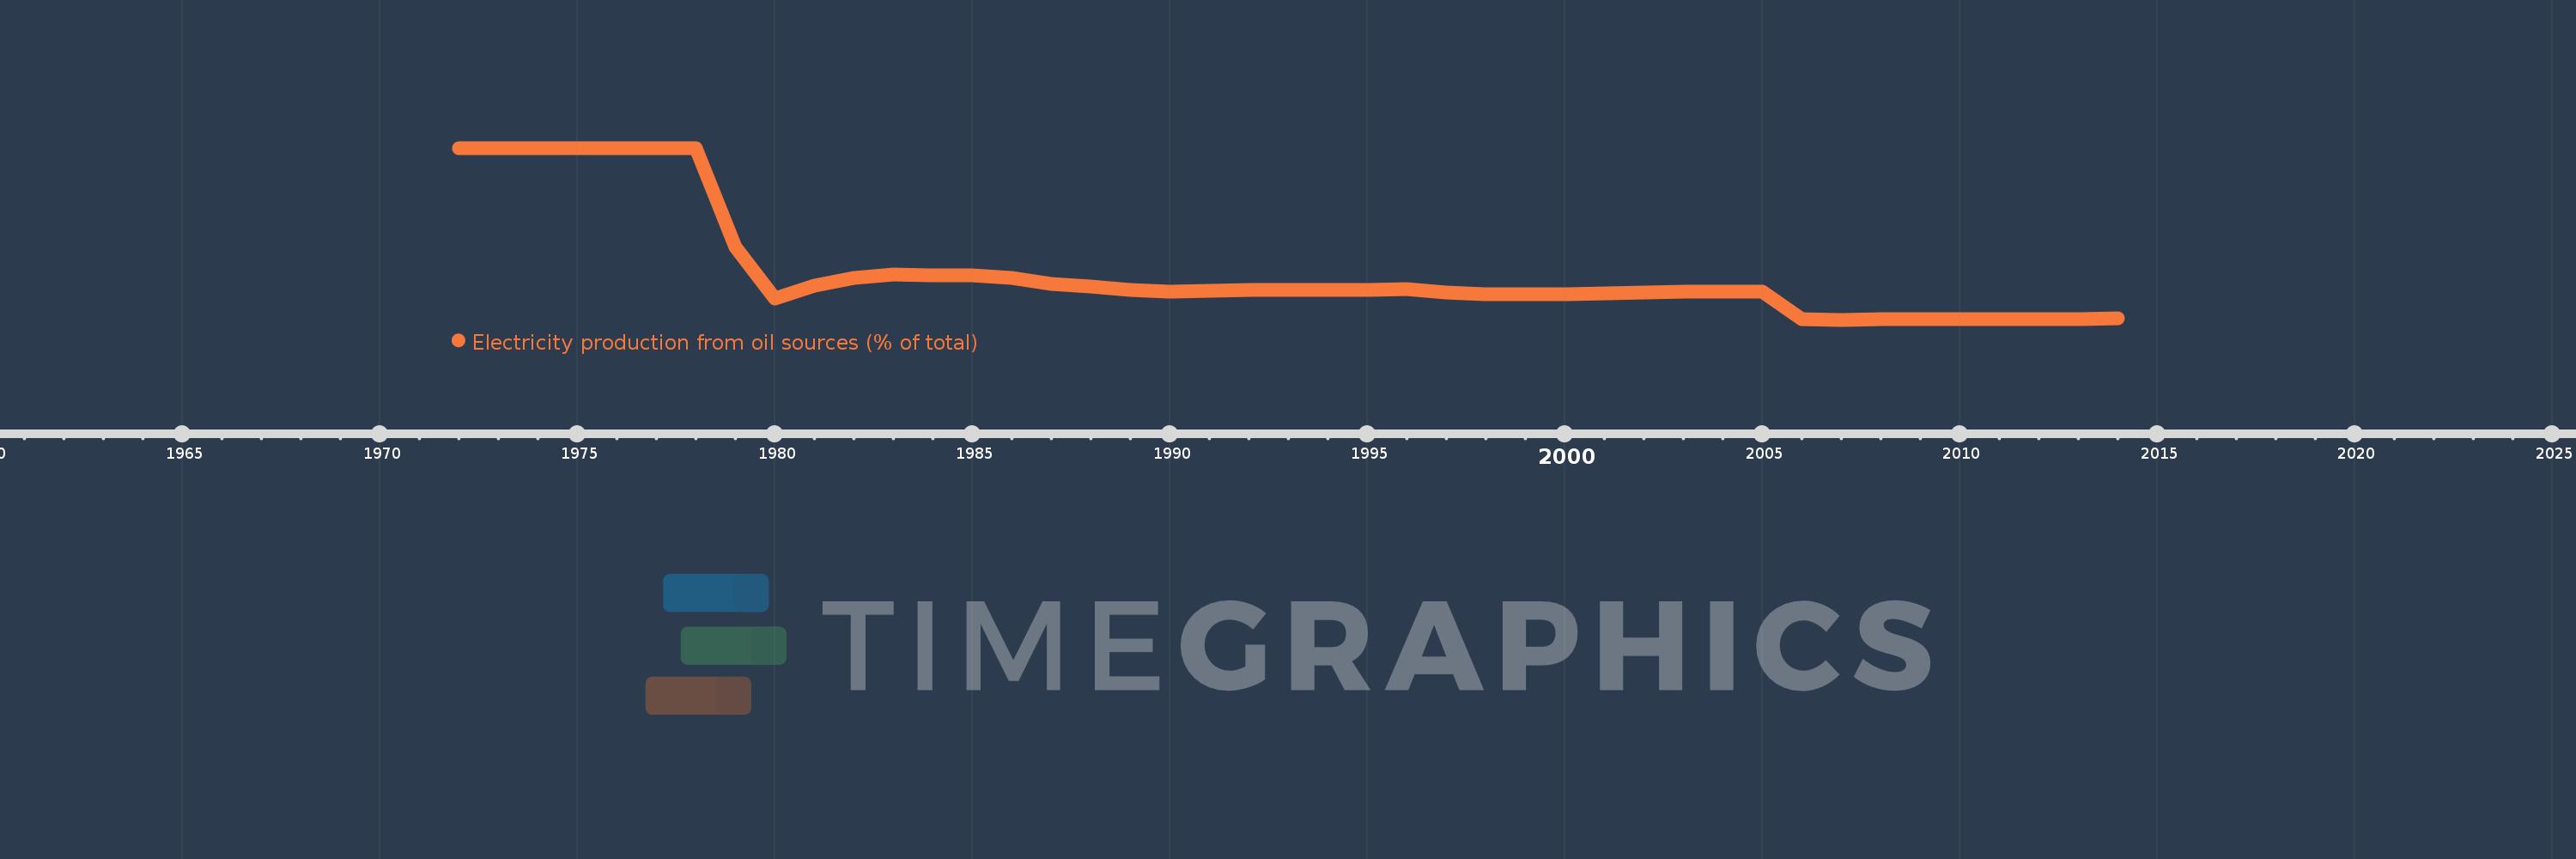
Electricity production from oil sources (% of total)
2014,2013,2012,2011,2010,2009,2008,2007,2006,2005,2004,2003,2002,2001,2000,1999,1998,1997,1996,1995,1994,1993,1992,1991,1990,1989,1988,1987,1986,1985,1984,1983,1982,1981,1980,1979,1978,1977,1976,1975,1974,1973,1972
This statistics in other country:
AlbaniaAlgeriaAngolaArab WorldArgentinaArmeniaAustraliaAustriaAzerbaijanBahrainBangladeshBelarusBelgiumBeninBoliviaBosnia and HerzegovinaBotswanaBrazilBrunei DarussalamBulgariaCambodiaCameroonCanadaCentral Europe and the BalticsChileChinaColombiaCongo, Dem. Rep.Congo, Rep.Costa RicaCote d'IvoireCroatiaCubaCuracaoCyprusCzech RepublicDenmarkDominican RepublicEarly-demographic dividendEast Asia & PacificEast Asia & Pacific (excluding high income)East Asia & Pacific (IDA & IBRD countries)EcuadorEgypt, Arab Rep.El SalvadorEritreaEstoniaEthiopiaEuro areaEurope & Central AsiaEurope & Central Asia (excluding high income)Europe & Central Asia (IDA & IBRD countries)European UnionFinlandFragile and conflict affected situationsFranceGabonGeorgiaGermanyGhanaGibraltarGreeceGuatemalaHaitiHeavily indebted poor countries (HIPC)High incomeHondurasHong Kong SAR, ChinaHungaryIBRD onlyIcelandIDA & IBRD totalIDA blendIDA onlyIDA totalIndiaIndonesiaIran, Islamic Rep.IraqIrelandIsraelItalyJamaicaJapanJordanKazakhstanKenyaKorea, Dem. People’s Rep.Korea, Rep.KosovoKuwaitKyrgyz RepublicLate-demographic dividendLatin America & Caribbean Latin America & Caribbean (excluding high income)Latin America & the Caribbean (IDA & IBRD countries)LatviaLeast developed countries: UN classificationLebanonLibyaLithuaniaLow & middle incomeLower middle incomeLuxembourgMacedonia, FYRMalaysiaMaltaMauritiusMexicoMiddle East & North AfricaMiddle East & North Africa (excluding high income)Middle East & North Africa (IDA & IBRD countries)Middle incomeMoldovaMongoliaMontenegroMoroccoMozambiqueMyanmarNamibiaNepalNetherlandsNew ZealandNicaraguaNigerNigeriaNorth AmericaNorwayOECD membersOmanOther small statesPakistanPanamaParaguayPeruPhilippinesPolandPortugalPost-demographic dividendPre-demographic dividendQatarRomaniaRussian FederationSaudi ArabiaSenegalSerbiaSingaporeSlovak RepublicSloveniaSmall statesSouth AfricaSouth AsiaSouth Asia (IDA & IBRD)South SudanSpainSri LankaSub-Saharan Africa Sub-Saharan Africa (excluding high income)Sub-Saharan Africa (IDA & IBRD countries)SudanSwedenSwitzerlandSyrian Arab RepublicTajikistanTanzaniaThailandTogoTrinidad and TobagoTunisiaTurkeyTurkmenistanUkraineUnited Arab EmiratesUnited KingdomUnited StatesUpper middle incomeUruguayUzbekistanVenezuela, RBVietnamWorldYemen, Rep.ZambiaZimbabwe Timeline:
This timeline shows a graph from 1972 to 2014 of Oman. No data until 1971. Number of actual observations by date: 43.
Source name:
World Development Indicators
Source organization:
IEA Statistics © OECD/IEA 2014 (http://www.iea.org/stats/index.asp), subject to https://www.iea.org/t&c/termsandconditions/
Categories, topics:
Energy & Mining, Climate Change, Infrastructure
Last updated:
apr 23, 2017
Indicators value changes by year
At the date of observation
Value
Absolute change
Change from previous value
jan 1, 1972
100.0
+100.0
0.0%
jan 1, 1973
100.0
0.0
0.0%
jan 1, 1974
100.0
0.0
0.0%
jan 1, 1975
100.0
0.0
0.0%
jan 1, 1976
100.0
0.0
0.0%
jan 1, 1977
100.0
0.0
0.0%
jan 1, 1978
100.0
0.0
0.0%
jan 1, 1979
43.59
-56.41
-56.41%
jan 1, 1980
14.333
-29.256
-67.12%
jan 1, 1981
21.516
+7.183
50.11%
jan 1, 1982
25.908
+4.392
20.41%
jan 1, 1983
27.715
+1.806
6.97%
jan 1, 1984
27.121
-0.594
-2.14%
jan 1, 1985
27.133
+0.012
0.04%
jan 1, 1986
26.061
-1.072
-3.95%
jan 1, 1987
22.201
-3.86
-14.81%
jan 1, 1988
21.167
-1.034
-4.66%
jan 1, 1989
18.95
-2.217
-10.47%
jan 1, 1990
17.825
-1.125
-5.94%
jan 1, 1991
18.374
+0.548
3.08%
jan 1, 1992
18.876
+0.502
2.73%
jan 1, 1993
18.776
-0.1
-0.53%
jan 1, 1994
18.858
+0.083
0.44%
jan 1, 1995
19.167
+0.309
1.64%
jan 1, 1996
19.523
+0.356
1.86%
jan 1, 1997
17.451
-2.072
-10.61%
jan 1, 1998
16.466
-0.985
-5.64%
jan 1, 1999
16.598
+0.131
0.8%
jan 1, 2000
16.688
+0.091
0.55%
jan 1, 2001
17.166
+0.478
2.86%
jan 1, 2002
17.665
+0.499
2.9%
jan 1, 2003
18.004
+0.339
1.92%
jan 1, 2004
18.004
+0.0
0.0%
jan 1, 2005
18.002
-0.003
-0.02%
jan 1, 2006
2.093
-15.909
-88.37%
jan 1, 2007
1.991
-0.102
-4.88%
jan 1, 2008
2.117
+0.126
6.33%
jan 1, 2009
2.175
+0.058
2.73%
jan 1, 2010
2.147
-0.028
-1.27%
jan 1, 2011
2.245
+0.098
4.58%
jan 1, 2012
2.345
+0.1
4.45%
jan 1, 2013
2.418
+0.073
3.12%
jan 1, 2014
2.611
+0.192
7.95%
Ranking of countries by current statistics by years


Comments: