29
/
en
AIzaSyAYiBZKx7MnpbEhh9jyipgxe19OcubqV5w
April 1, 2024
247437
Spain
ESP
true
2
1
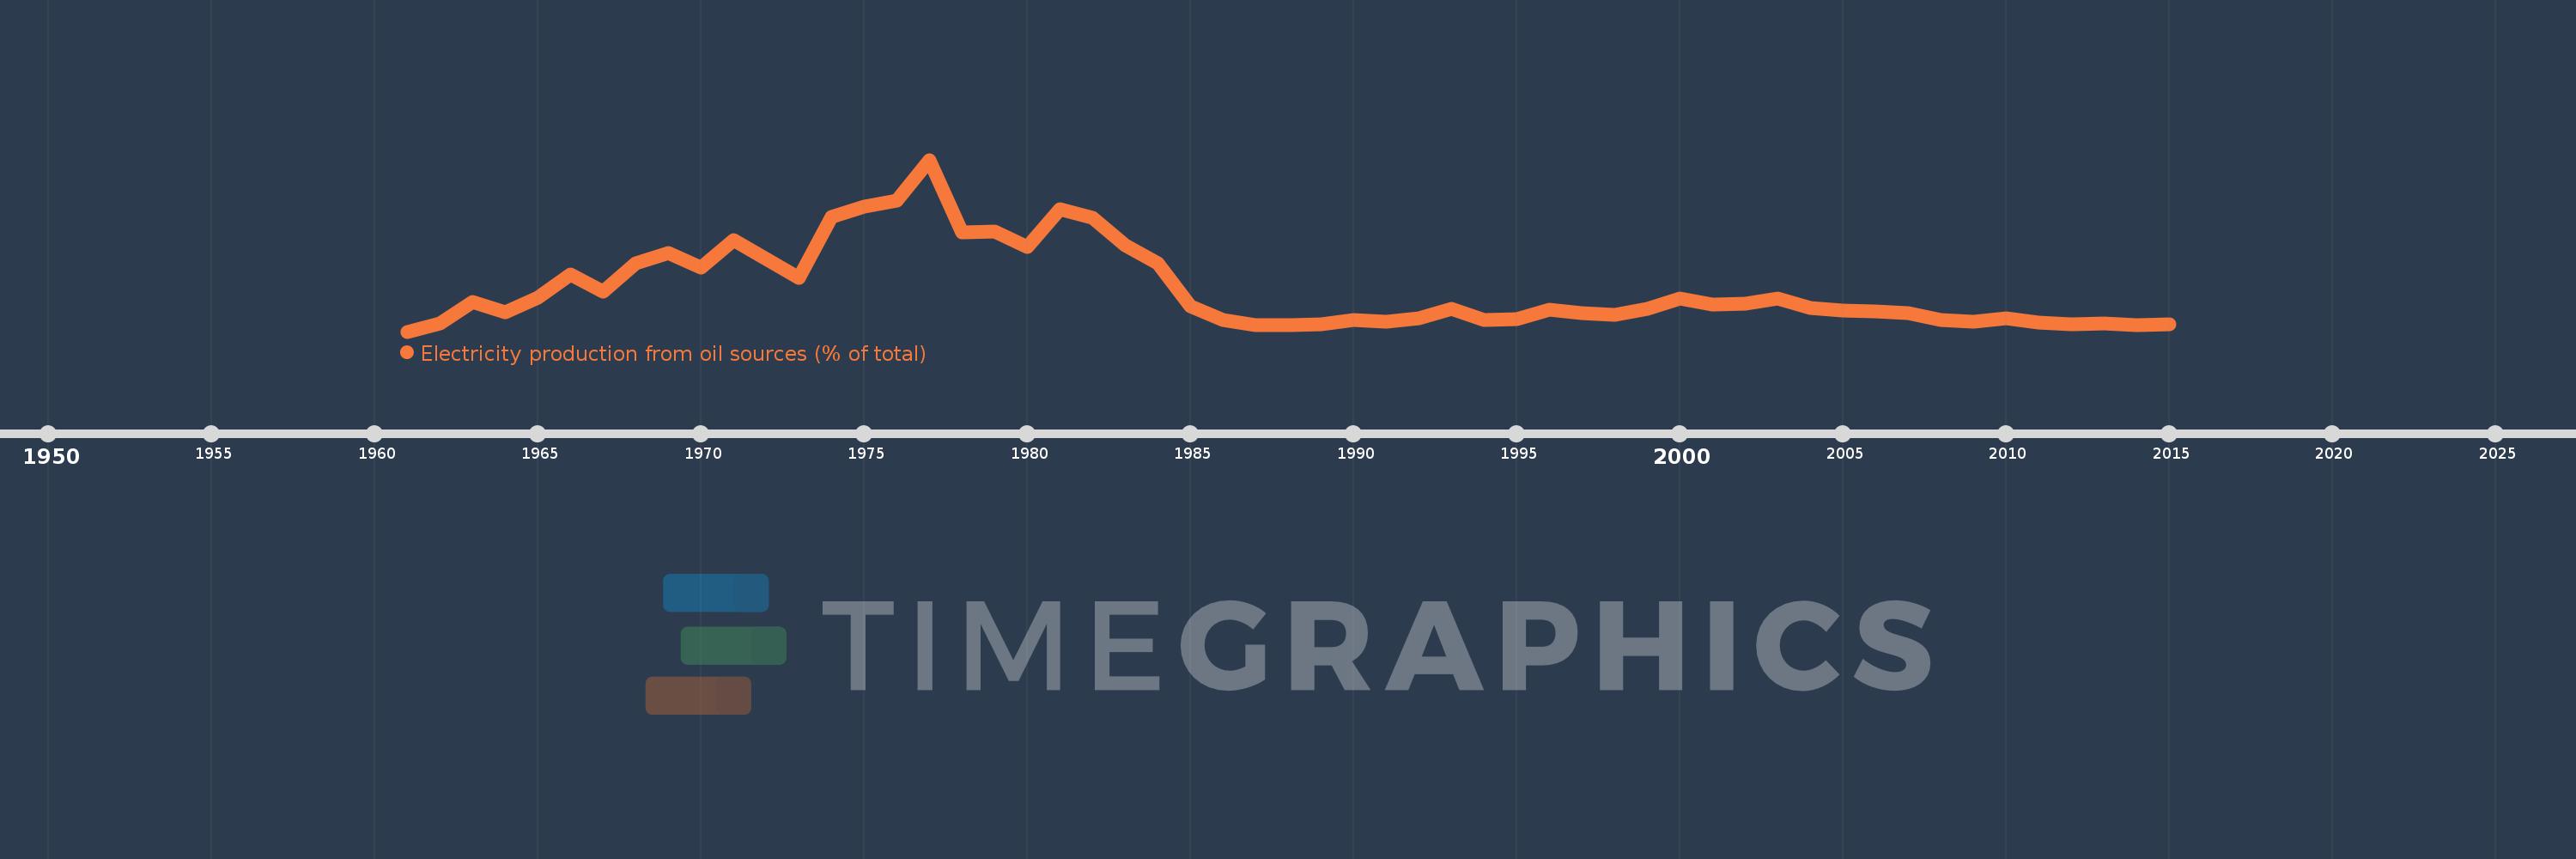
Electricity production from oil sources (% of total)
2015,2014,2013,2012,2011,2010,2009,2008,2007,2006,2005,2004,2003,2002,2001,2000,1999,1998,1997,1996,1995,1994,1993,1992,1991,1990,1989,1988,1987,1986,1985,1984,1983,1982,1981,1980,1979,1978,1977,1976,1975,1974,1973,1972,1971,1970,1969,1968,1967,1966,1965,1964,1963,1962,1961
This statistics in other country:
AlbaniaAlgeriaAngolaArab WorldArgentinaArmeniaAustraliaAustriaAzerbaijanBahrainBangladeshBelarusBelgiumBeninBoliviaBosnia and HerzegovinaBotswanaBrazilBrunei DarussalamBulgariaCambodiaCameroonCanadaCentral Europe and the BalticsChileChinaColombiaCongo, Dem. Rep.Congo, Rep.Costa RicaCote d'IvoireCroatiaCubaCuracaoCyprusCzech RepublicDenmarkDominican RepublicEarly-demographic dividendEast Asia & PacificEast Asia & Pacific (excluding high income)East Asia & Pacific (IDA & IBRD countries)EcuadorEgypt, Arab Rep.El SalvadorEritreaEstoniaEthiopiaEuro areaEurope & Central AsiaEurope & Central Asia (excluding high income)Europe & Central Asia (IDA & IBRD countries)European UnionFinlandFragile and conflict affected situationsFranceGabonGeorgiaGermanyGhanaGibraltarGreeceGuatemalaHaitiHeavily indebted poor countries (HIPC)High incomeHondurasHong Kong SAR, ChinaHungaryIBRD onlyIcelandIDA & IBRD totalIDA blendIDA onlyIDA totalIndiaIndonesiaIran, Islamic Rep.IraqIrelandIsraelItalyJamaicaJapanJordanKazakhstanKenyaKorea, Dem. People’s Rep.Korea, Rep.KosovoKuwaitKyrgyz RepublicLate-demographic dividendLatin America & Caribbean Latin America & Caribbean (excluding high income)Latin America & the Caribbean (IDA & IBRD countries)LatviaLeast developed countries: UN classificationLebanonLibyaLithuaniaLow & middle incomeLower middle incomeLuxembourgMacedonia, FYRMalaysiaMaltaMauritiusMexicoMiddle East & North AfricaMiddle East & North Africa (excluding high income)Middle East & North Africa (IDA & IBRD countries)Middle incomeMoldovaMongoliaMontenegroMoroccoMozambiqueMyanmarNamibiaNepalNetherlandsNew ZealandNicaraguaNigerNigeriaNorth AmericaNorwayOECD membersOmanOther small statesPakistanPanamaParaguayPeruPhilippinesPolandPortugalPost-demographic dividendPre-demographic dividendQatarRomaniaRussian FederationSaudi ArabiaSenegalSerbiaSingaporeSlovak RepublicSloveniaSmall statesSouth AfricaSouth AsiaSouth Asia (IDA & IBRD)South SudanSpainSri LankaSub-Saharan Africa Sub-Saharan Africa (excluding high income)Sub-Saharan Africa (IDA & IBRD countries)SudanSwedenSwitzerlandSyrian Arab RepublicTajikistanTanzaniaThailandTogoTrinidad and TobagoTunisiaTurkeyTurkmenistanUkraineUnited Arab EmiratesUnited KingdomUnited StatesUpper middle incomeUruguayUzbekistanVenezuela, RBVietnamWorldYemen, Rep.ZambiaZimbabwe Timeline:
This timeline shows a graph from 1961 to 2015 of Spain. No data until 1960. Number of actual observations by date: 55.
Source name:
World Development Indicators
Source organization:
IEA Statistics © OECD/IEA 2014 (http://www.iea.org/stats/index.asp), subject to https://www.iea.org/t&c/termsandconditions/
Categories, topics:
Energy & Mining, Climate Change, Infrastructure
Last updated:
apr 23, 2017
Indicators value changes by year
Maximum:
48.248
jan 1, 1977
At the date of observation
Value
Absolute change
Change from previous value
jan 1, 1961
3.164
+3.164
0.0%
jan 1, 1962
5.388
+2.224
70.29%
jan 1, 1963
10.871
+5.483
101.75%
jan 1, 1964
8.236
-2.635
-24.23%
jan 1, 1965
12.155
+3.919
47.58%
jan 1, 1966
18.062
+5.907
48.59%
jan 1, 1967
13.581
-4.482
-24.81%
jan 1, 1968
21.096
+7.516
55.34%
jan 1, 1969
23.831
+2.734
12.96%
jan 1, 1970
19.971
-3.86
-16.2%
jan 1, 1971
27.228
+7.257
36.34%
jan 1, 1972
22.238
-4.99
-18.33%
jan 1, 1973
17.363
-4.875
-21.92%
jan 1, 1974
33.188
+15.825
91.14%
jan 1, 1975
36.032
+2.844
8.57%
jan 1, 1976
37.472
+1.44
4.0%
jan 1, 1977
48.248
+10.776
28.76%
jan 1, 1978
29.132
-19.116
-39.62%
jan 1, 1979
29.342
+0.211
0.72%
jan 1, 1980
25.377
-3.965
-13.51%
jan 1, 1981
35.192
+9.815
38.67%
jan 1, 1982
33.09
-2.102
-5.97%
jan 1, 1983
25.823
-7.267
-21.96%
jan 1, 1984
21.143
-4.681
-18.13%
jan 1, 1985
9.734
-11.409
-53.96%
jan 1, 1986
6.167
-3.566
-36.64%
jan 1, 1987
4.825
-1.342
-21.76%
jan 1, 1988
4.853
+0.028
0.59%
jan 1, 1989
5.006
+0.152
3.13%
jan 1, 1990
6.208
+1.202
24.02%
jan 1, 1991
5.69
-0.518
-8.34%
jan 1, 1992
6.563
+0.873
15.34%
jan 1, 1993
9.144
+2.581
39.33%
jan 1, 1994
6.14
-3.004
-32.85%
jan 1, 1995
6.531
+0.391
6.37%
jan 1, 1996
8.831
+2.299
35.2%
jan 1, 1997
8.029
-0.801
-9.07%
jan 1, 1998
7.456
-0.573
-7.14%
jan 1, 1999
9.048
+1.592
21.36%
jan 1, 2000
11.876
+2.827
31.25%
jan 1, 2001
10.22
-1.656
-13.94%
jan 1, 2002
10.569
+0.349
3.41%
jan 1, 2003
11.918
+1.349
12.77%
jan 1, 2004
9.328
-2.59
-21.73%
jan 1, 2005
8.617
-0.711
-7.62%
jan 1, 2006
8.437
-0.18
-2.09%
jan 1, 2007
8.062
-0.375
-4.45%
jan 1, 2008
6.132
-1.93
-23.94%
jan 1, 2009
5.789
-0.343
-5.59%
jan 1, 2010
6.593
+0.804
13.89%
jan 1, 2011
5.552
-1.041
-15.79%
jan 1, 2012
5.04
-0.512
-9.23%
jan 1, 2013
5.212
+0.173
3.43%
jan 1, 2014
4.928
-0.284
-5.45%
jan 1, 2015
5.173
+0.245
4.97%
Ranking of countries by current statistics by years


Comments: