29
/
en
AIzaSyAYiBZKx7MnpbEhh9jyipgxe19OcubqV5w
April 1, 2024
150250
Honduras
HND
true
2
1
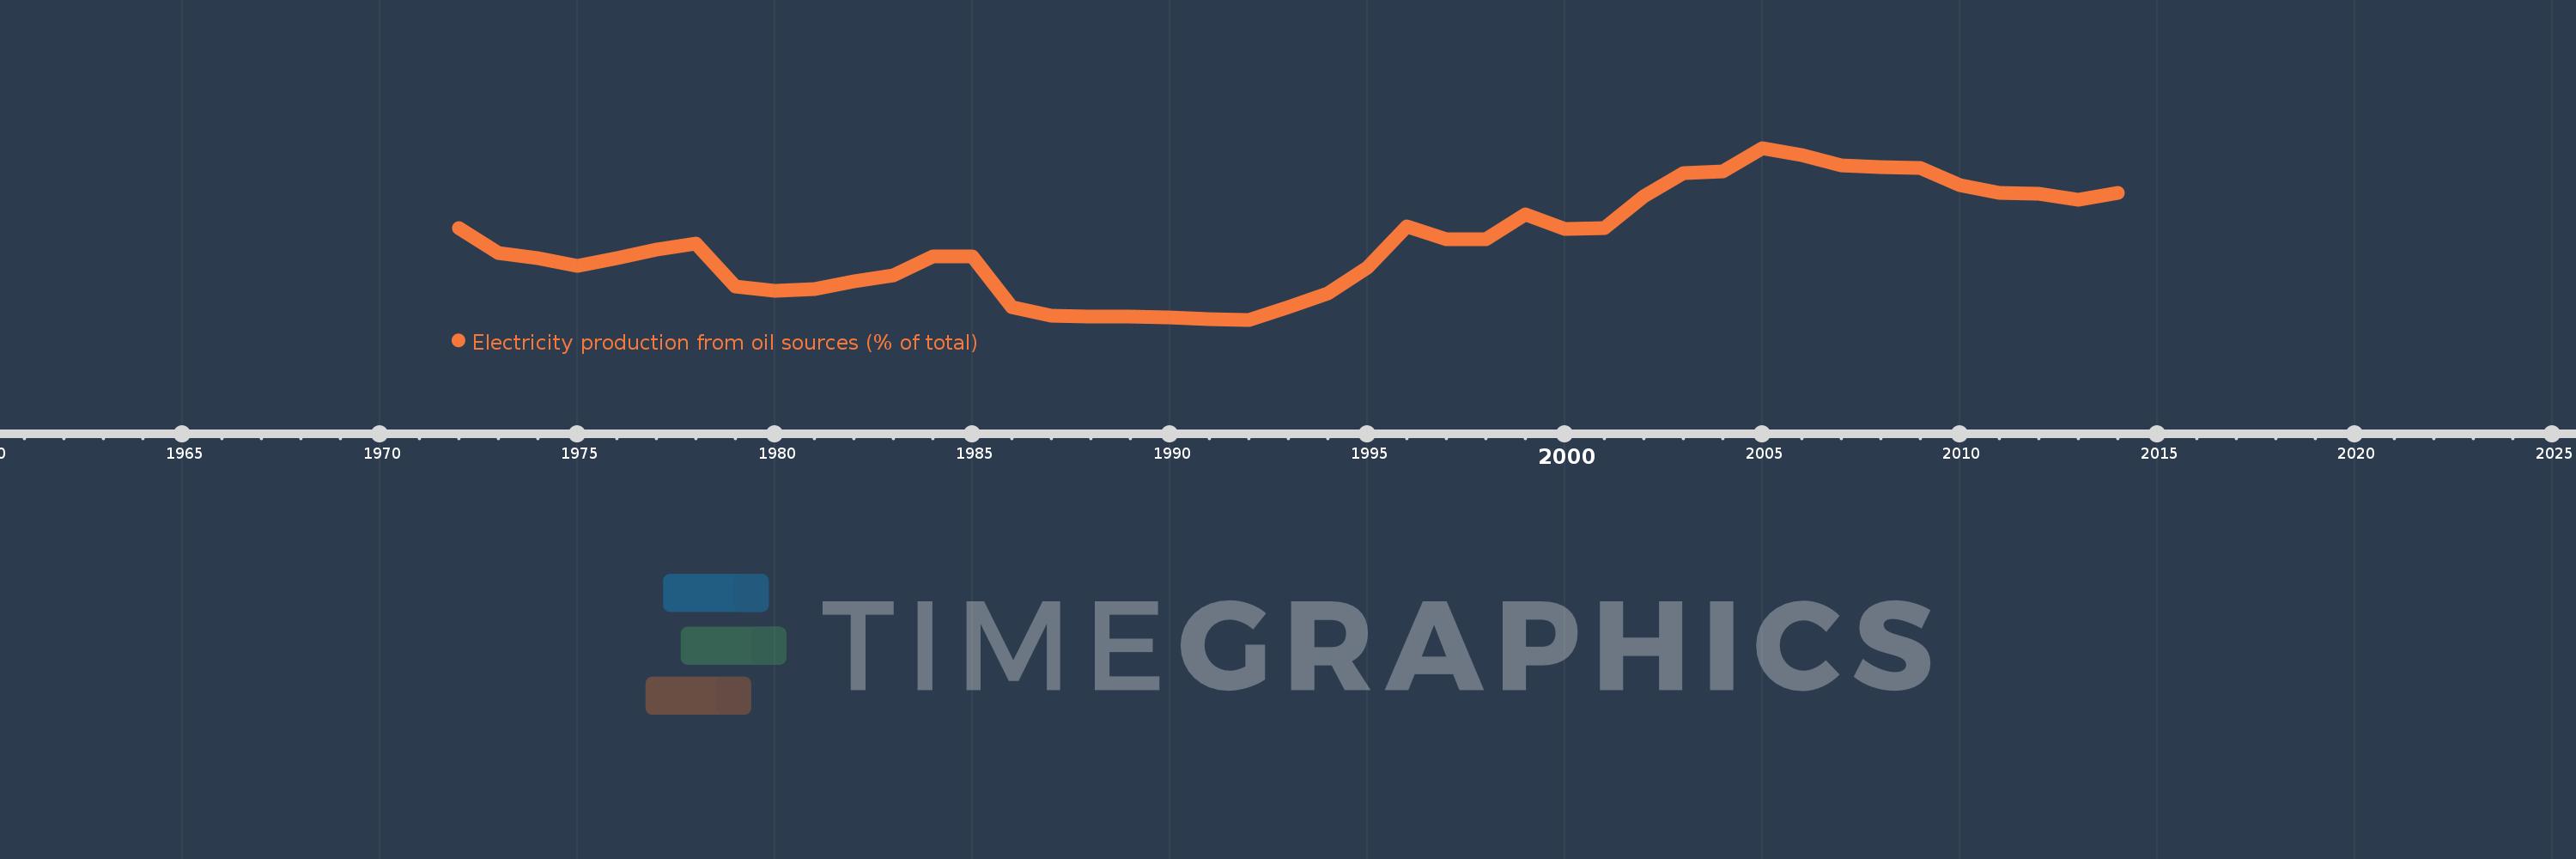
Electricity production from oil sources (% of total)
2014,2013,2012,2011,2010,2009,2008,2007,2006,2005,2004,2003,2002,2001,2000,1999,1998,1997,1996,1995,1994,1993,1992,1991,1990,1989,1988,1987,1986,1985,1984,1983,1982,1981,1980,1979,1978,1977,1976,1975,1974,1973,1972
This statistics in other country:
AlbaniaAlgeriaAngolaArab WorldArgentinaArmeniaAustraliaAustriaAzerbaijanBahrainBangladeshBelarusBelgiumBeninBoliviaBosnia and HerzegovinaBotswanaBrazilBrunei DarussalamBulgariaCambodiaCameroonCanadaCentral Europe and the BalticsChileChinaColombiaCongo, Dem. Rep.Congo, Rep.Costa RicaCote d'IvoireCroatiaCubaCuracaoCyprusCzech RepublicDenmarkDominican RepublicEarly-demographic dividendEast Asia & PacificEast Asia & Pacific (excluding high income)East Asia & Pacific (IDA & IBRD countries)EcuadorEgypt, Arab Rep.El SalvadorEritreaEstoniaEthiopiaEuro areaEurope & Central AsiaEurope & Central Asia (excluding high income)Europe & Central Asia (IDA & IBRD countries)European UnionFinlandFragile and conflict affected situationsFranceGabonGeorgiaGermanyGhanaGibraltarGreeceGuatemalaHaitiHeavily indebted poor countries (HIPC)High incomeHondurasHong Kong SAR, ChinaHungaryIBRD onlyIcelandIDA & IBRD totalIDA blendIDA onlyIDA totalIndiaIndonesiaIran, Islamic Rep.IraqIrelandIsraelItalyJamaicaJapanJordanKazakhstanKenyaKorea, Dem. People’s Rep.Korea, Rep.KosovoKuwaitKyrgyz RepublicLate-demographic dividendLatin America & Caribbean Latin America & Caribbean (excluding high income)Latin America & the Caribbean (IDA & IBRD countries)LatviaLeast developed countries: UN classificationLebanonLibyaLithuaniaLow & middle incomeLower middle incomeLuxembourgMacedonia, FYRMalaysiaMaltaMauritiusMexicoMiddle East & North AfricaMiddle East & North Africa (excluding high income)Middle East & North Africa (IDA & IBRD countries)Middle incomeMoldovaMongoliaMontenegroMoroccoMozambiqueMyanmarNamibiaNepalNetherlandsNew ZealandNicaraguaNigerNigeriaNorth AmericaNorwayOECD membersOmanOther small statesPakistanPanamaParaguayPeruPhilippinesPolandPortugalPost-demographic dividendPre-demographic dividendQatarRomaniaRussian FederationSaudi ArabiaSenegalSerbiaSingaporeSlovak RepublicSloveniaSmall statesSouth AfricaSouth AsiaSouth Asia (IDA & IBRD)South SudanSpainSri LankaSub-Saharan Africa Sub-Saharan Africa (excluding high income)Sub-Saharan Africa (IDA & IBRD countries)SudanSwedenSwitzerlandSyrian Arab RepublicTajikistanTanzaniaThailandTogoTrinidad and TobagoTunisiaTurkeyTurkmenistanUkraineUnited Arab EmiratesUnited KingdomUnited StatesUpper middle incomeUruguayUzbekistanVenezuela, RBVietnamWorldYemen, Rep.ZambiaZimbabwe Timeline:
This timeline shows a graph from 1972 to 2014 of Honduras. No data until 1971. Number of actual observations by date: 43.
Source name:
World Development Indicators
Source organization:
IEA Statistics © OECD/IEA 2014 (http://www.iea.org/stats/index.asp), subject to https://www.iea.org/t&c/termsandconditions/
Categories, topics:
Energy & Mining, Climate Change, Infrastructure
Last updated:
apr 23, 2017
Indicators value changes by year
Maximum:
70.033
jan 1, 2005
At the date of observation
Value
Absolute change
Change from previous value
jan 1, 1972
38.107
+38.107
0.0%
jan 1, 1973
28.132
-9.975
-26.18%
jan 1, 1974
26.132
-2.001
-7.11%
jan 1, 1975
22.929
-3.203
-12.26%
jan 1, 1976
25.926
+2.997
13.07%
jan 1, 1977
29.412
+3.486
13.45%
jan 1, 1978
31.831
+2.42
8.23%
jan 1, 1979
14.756
-17.075
-53.64%
jan 1, 1980
12.926
-1.83
-12.4%
jan 1, 1981
13.687
+0.761
5.88%
jan 1, 1982
16.903
+3.216
23.5%
jan 1, 1983
19.198
+2.295
13.58%
jan 1, 1984
26.849
+7.651
39.85%
jan 1, 1985
26.801
-0.048
-0.18%
jan 1, 1986
6.452
-20.349
-75.93%
jan 1, 1987
3.055
-3.397
-52.65%
jan 1, 1988
2.782
-0.273
-8.92%
jan 1, 1989
2.764
-0.019
-0.68%
jan 1, 1990
2.398
-0.365
-13.21%
jan 1, 1991
1.725
-0.674
-28.08%
jan 1, 1992
1.449
-0.276
-15.98%
jan 1, 1993
6.445
+4.995
344.69%
jan 1, 1994
11.866
+5.421
84.12%
jan 1, 1995
22.184
+10.318
86.96%
jan 1, 1996
38.673
+16.489
74.33%
jan 1, 1997
33.518
-5.155
-13.33%
jan 1, 1998
33.514
-0.004
-0.01%
jan 1, 1999
43.69
+10.176
30.36%
jan 1, 2000
37.853
-5.837
-13.36%
jan 1, 2001
38.089
+0.236
0.62%
jan 1, 2002
50.747
+12.658
33.23%
jan 1, 2003
60.034
+9.287
18.3%
jan 1, 2004
60.825
+0.79
1.32%
jan 1, 2005
70.033
+9.208
15.14%
jan 1, 2006
67.053
-2.98
-4.25%
jan 1, 2007
63.072
-3.982
-5.94%
jan 1, 2008
62.399
-0.672
-1.07%
jan 1, 2009
62.009
-0.39
-0.62%
jan 1, 2010
55.245
-6.764
-10.91%
jan 1, 2011
52.191
-3.054
-5.53%
jan 1, 2012
51.901
-0.29
-0.56%
jan 1, 2013
49.496
-2.405
-4.63%
jan 1, 2014
52.093
+2.597
5.25%
Ranking of countries by current statistics by years


Comments: