29
/
en
AIzaSyAYiBZKx7MnpbEhh9jyipgxe19OcubqV5w
April 1, 2024
134005
France
FRA
true
2
1
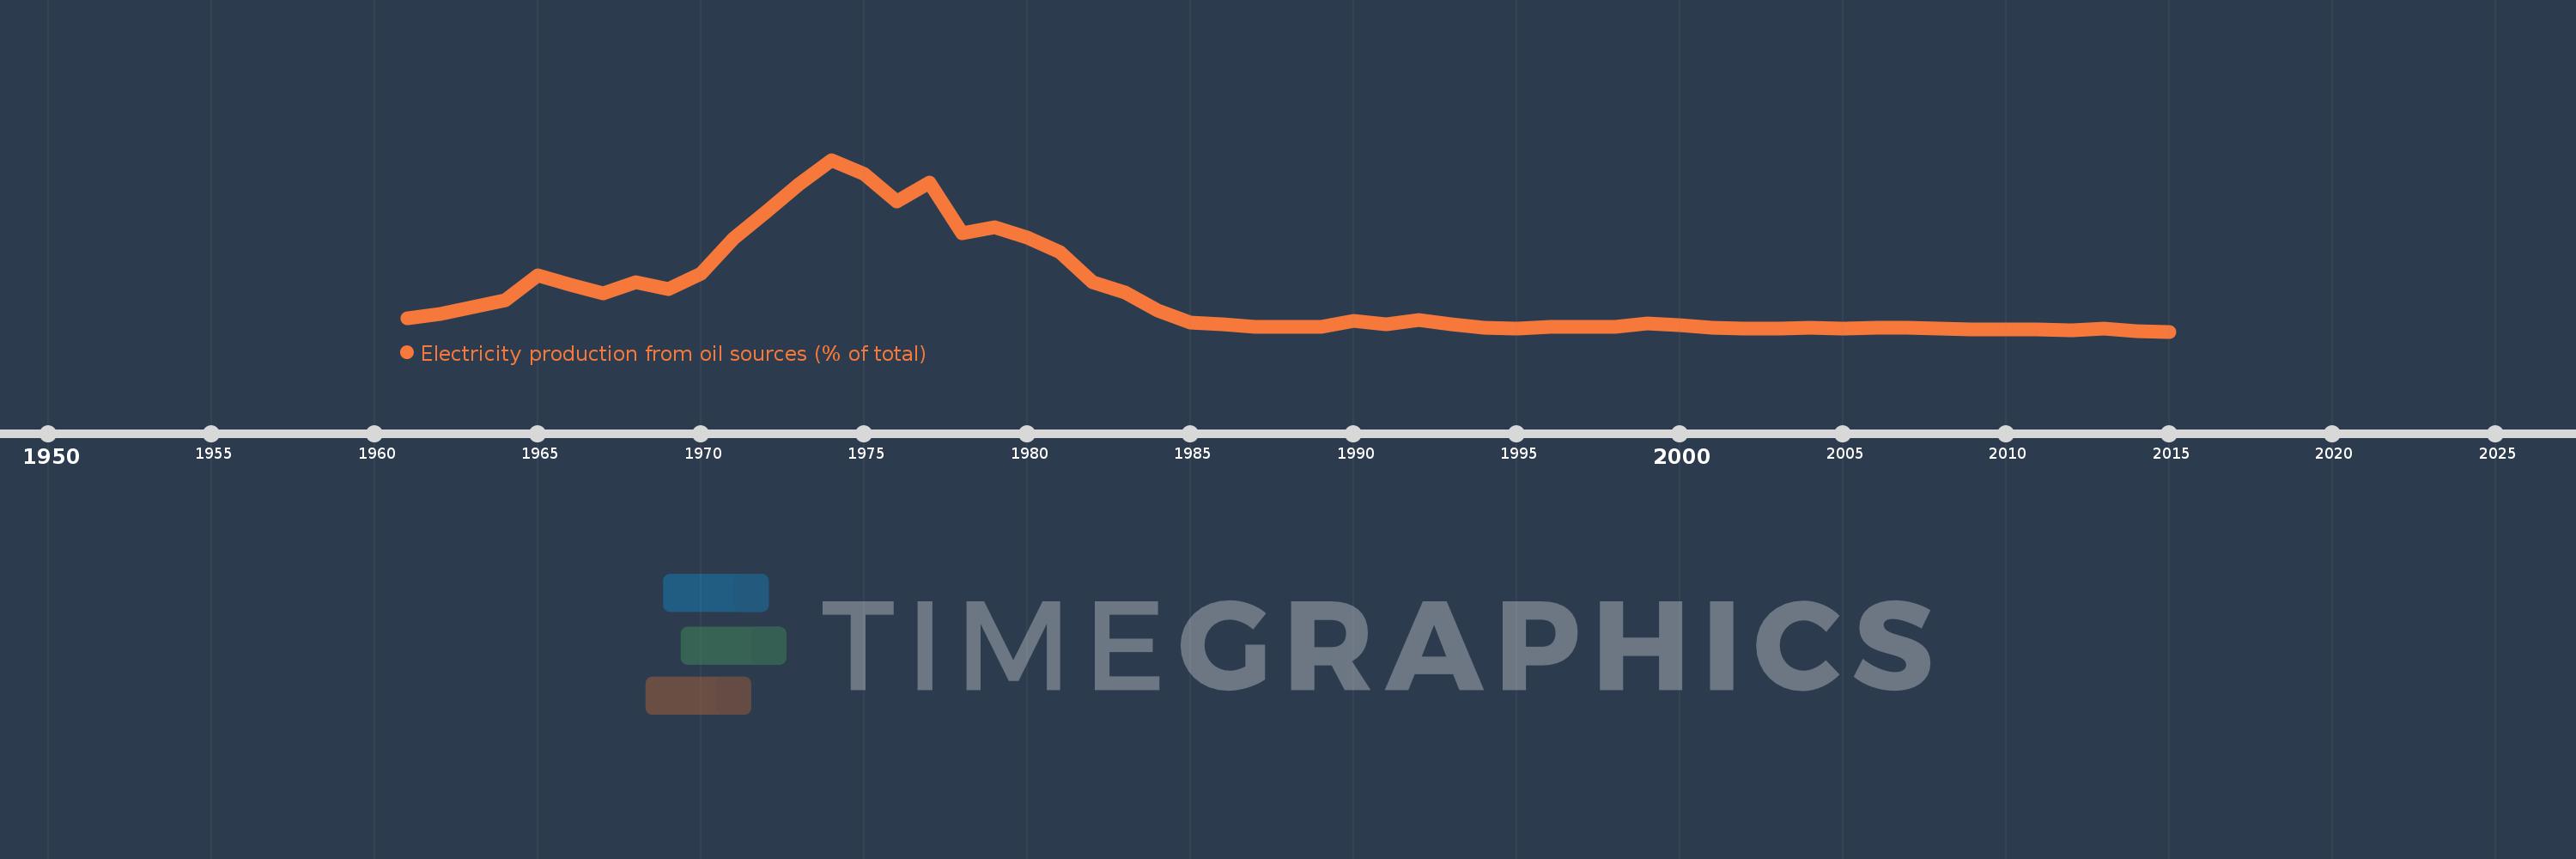
Electricity production from oil sources (% of total)
2015,2014,2013,2012,2011,2010,2009,2008,2007,2006,2005,2004,2003,2002,2001,2000,1999,1998,1997,1996,1995,1994,1993,1992,1991,1990,1989,1988,1987,1986,1985,1984,1983,1982,1981,1980,1979,1978,1977,1976,1975,1974,1973,1972,1971,1970,1969,1968,1967,1966,1965,1964,1963,1962,1961
This statistics in other country:
AlbaniaAlgeriaAngolaArab WorldArgentinaArmeniaAustraliaAustriaAzerbaijanBahrainBangladeshBelarusBelgiumBeninBoliviaBosnia and HerzegovinaBotswanaBrazilBrunei DarussalamBulgariaCambodiaCameroonCanadaCentral Europe and the BalticsChileChinaColombiaCongo, Dem. Rep.Congo, Rep.Costa RicaCote d'IvoireCroatiaCubaCuracaoCyprusCzech RepublicDenmarkDominican RepublicEarly-demographic dividendEast Asia & PacificEast Asia & Pacific (excluding high income)East Asia & Pacific (IDA & IBRD countries)EcuadorEgypt, Arab Rep.El SalvadorEritreaEstoniaEthiopiaEuro areaEurope & Central AsiaEurope & Central Asia (excluding high income)Europe & Central Asia (IDA & IBRD countries)European UnionFinlandFragile and conflict affected situationsFranceGabonGeorgiaGermanyGhanaGibraltarGreeceGuatemalaHaitiHeavily indebted poor countries (HIPC)High incomeHondurasHong Kong SAR, ChinaHungaryIBRD onlyIcelandIDA & IBRD totalIDA blendIDA onlyIDA totalIndiaIndonesiaIran, Islamic Rep.IraqIrelandIsraelItalyJamaicaJapanJordanKazakhstanKenyaKorea, Dem. People’s Rep.Korea, Rep.KosovoKuwaitKyrgyz RepublicLate-demographic dividendLatin America & Caribbean Latin America & Caribbean (excluding high income)Latin America & the Caribbean (IDA & IBRD countries)LatviaLeast developed countries: UN classificationLebanonLibyaLithuaniaLow & middle incomeLower middle incomeLuxembourgMacedonia, FYRMalaysiaMaltaMauritiusMexicoMiddle East & North AfricaMiddle East & North Africa (excluding high income)Middle East & North Africa (IDA & IBRD countries)Middle incomeMoldovaMongoliaMontenegroMoroccoMozambiqueMyanmarNamibiaNepalNetherlandsNew ZealandNicaraguaNigerNigeriaNorth AmericaNorwayOECD membersOmanOther small statesPakistanPanamaParaguayPeruPhilippinesPolandPortugalPost-demographic dividendPre-demographic dividendQatarRomaniaRussian FederationSaudi ArabiaSenegalSerbiaSingaporeSlovak RepublicSloveniaSmall statesSouth AfricaSouth AsiaSouth Asia (IDA & IBRD)South SudanSpainSri LankaSub-Saharan Africa Sub-Saharan Africa (excluding high income)Sub-Saharan Africa (IDA & IBRD countries)SudanSwedenSwitzerlandSyrian Arab RepublicTajikistanTanzaniaThailandTogoTrinidad and TobagoTunisiaTurkeyTurkmenistanUkraineUnited Arab EmiratesUnited KingdomUnited StatesUpper middle incomeUruguayUzbekistanVenezuela, RBVietnamWorldYemen, Rep.ZambiaZimbabwe Timeline:
This timeline shows a graph from 1961 to 2015 of France. No data until 1960. Number of actual observations by date: 55.
Source name:
World Development Indicators
Source organization:
IEA Statistics © OECD/IEA 2014 (http://www.iea.org/stats/index.asp), subject to https://www.iea.org/t&c/termsandconditions/
Categories, topics:
Energy & Mining, Climate Change, Infrastructure
Last updated:
apr 23, 2017
Indicators value changes by year
Maximum:
40.169
jan 1, 1974
At the date of observation
Value
Absolute change
Change from previous value
jan 1, 1961
3.548
+3.548
0.0%
jan 1, 1962
4.446
+0.899
25.33%
jan 1, 1963
6.17
+1.723
38.75%
jan 1, 1964
7.748
+1.578
25.58%
jan 1, 1965
13.423
+5.675
73.25%
jan 1, 1966
11.306
-2.117
-15.77%
jan 1, 1967
9.327
-1.979
-17.5%
jan 1, 1968
11.863
+2.535
27.18%
jan 1, 1969
10.329
-1.534
-12.93%
jan 1, 1970
13.885
+3.556
34.43%
jan 1, 1971
21.967
+8.082
58.21%
jan 1, 1972
28.086
+6.118
27.85%
jan 1, 1973
34.475
+6.389
22.75%
jan 1, 1974
40.169
+5.695
16.52%
jan 1, 1975
36.936
-3.234
-8.05%
jan 1, 1976
30.456
-6.48
-17.54%
jan 1, 1977
34.937
+4.481
14.71%
jan 1, 1978
23.153
-11.784
-33.73%
jan 1, 1979
24.544
+1.391
6.01%
jan 1, 1980
22.083
-2.461
-10.03%
jan 1, 1981
18.825
-3.258
-14.75%
jan 1, 1982
11.798
-7.028
-37.33%
jan 1, 1983
9.373
-2.424
-20.55%
jan 1, 1984
5.257
-4.117
-43.92%
jan 1, 1985
2.576
-2.681
-51.0%
jan 1, 1986
2.062
-0.514
-19.96%
jan 1, 1987
1.508
-0.554
-26.86%
jan 1, 1988
1.533
+0.025
1.63%
jan 1, 1989
1.443
-0.09
-5.86%
jan 1, 1990
2.906
+1.464
101.45%
jan 1, 1991
2.078
-0.829
-28.51%
jan 1, 1992
3.119
+1.041
50.1%
jan 1, 1993
2.026
-1.093
-35.04%
jan 1, 1994
1.297
-0.729
-35.98%
jan 1, 1995
1.184
-0.113
-8.74%
jan 1, 1996
1.578
+0.394
33.29%
jan 1, 1997
1.53
-0.048
-3.02%
jan 1, 1998
1.542
+0.012
0.81%
jan 1, 1999
2.297
+0.754
48.91%
jan 1, 2000
1.909
-0.388
-16.87%
jan 1, 2001
1.339
-0.571
-29.88%
jan 1, 2002
1.093
-0.246
-18.38%
jan 1, 2003
1.042
-0.051
-4.67%
jan 1, 2004
1.264
+0.222
21.32%
jan 1, 2005
1.148
-0.116
-9.17%
jan 1, 2006
1.387
+0.239
20.83%
jan 1, 2007
1.252
-0.135
-9.71%
jan 1, 2008
1.093
-0.16
-12.76%
jan 1, 2009
0.94
-0.153
-13.97%
jan 1, 2010
0.89
-0.05
-5.32%
jan 1, 2011
0.979
+0.089
9.95%
jan 1, 2012
0.615
-0.363
-37.13%
jan 1, 2013
1.108
+0.493
80.06%
jan 1, 2014
0.438
-0.67
-60.46%
jan 1, 2015
0.415
-0.023
-5.27%
Ranking of countries by current statistics by years


Comments: