29
/
en
AIzaSyAYiBZKx7MnpbEhh9jyipgxe19OcubqV5w
April 1, 2024
258219
Syrian Arab Republic
SYR
true
2
1
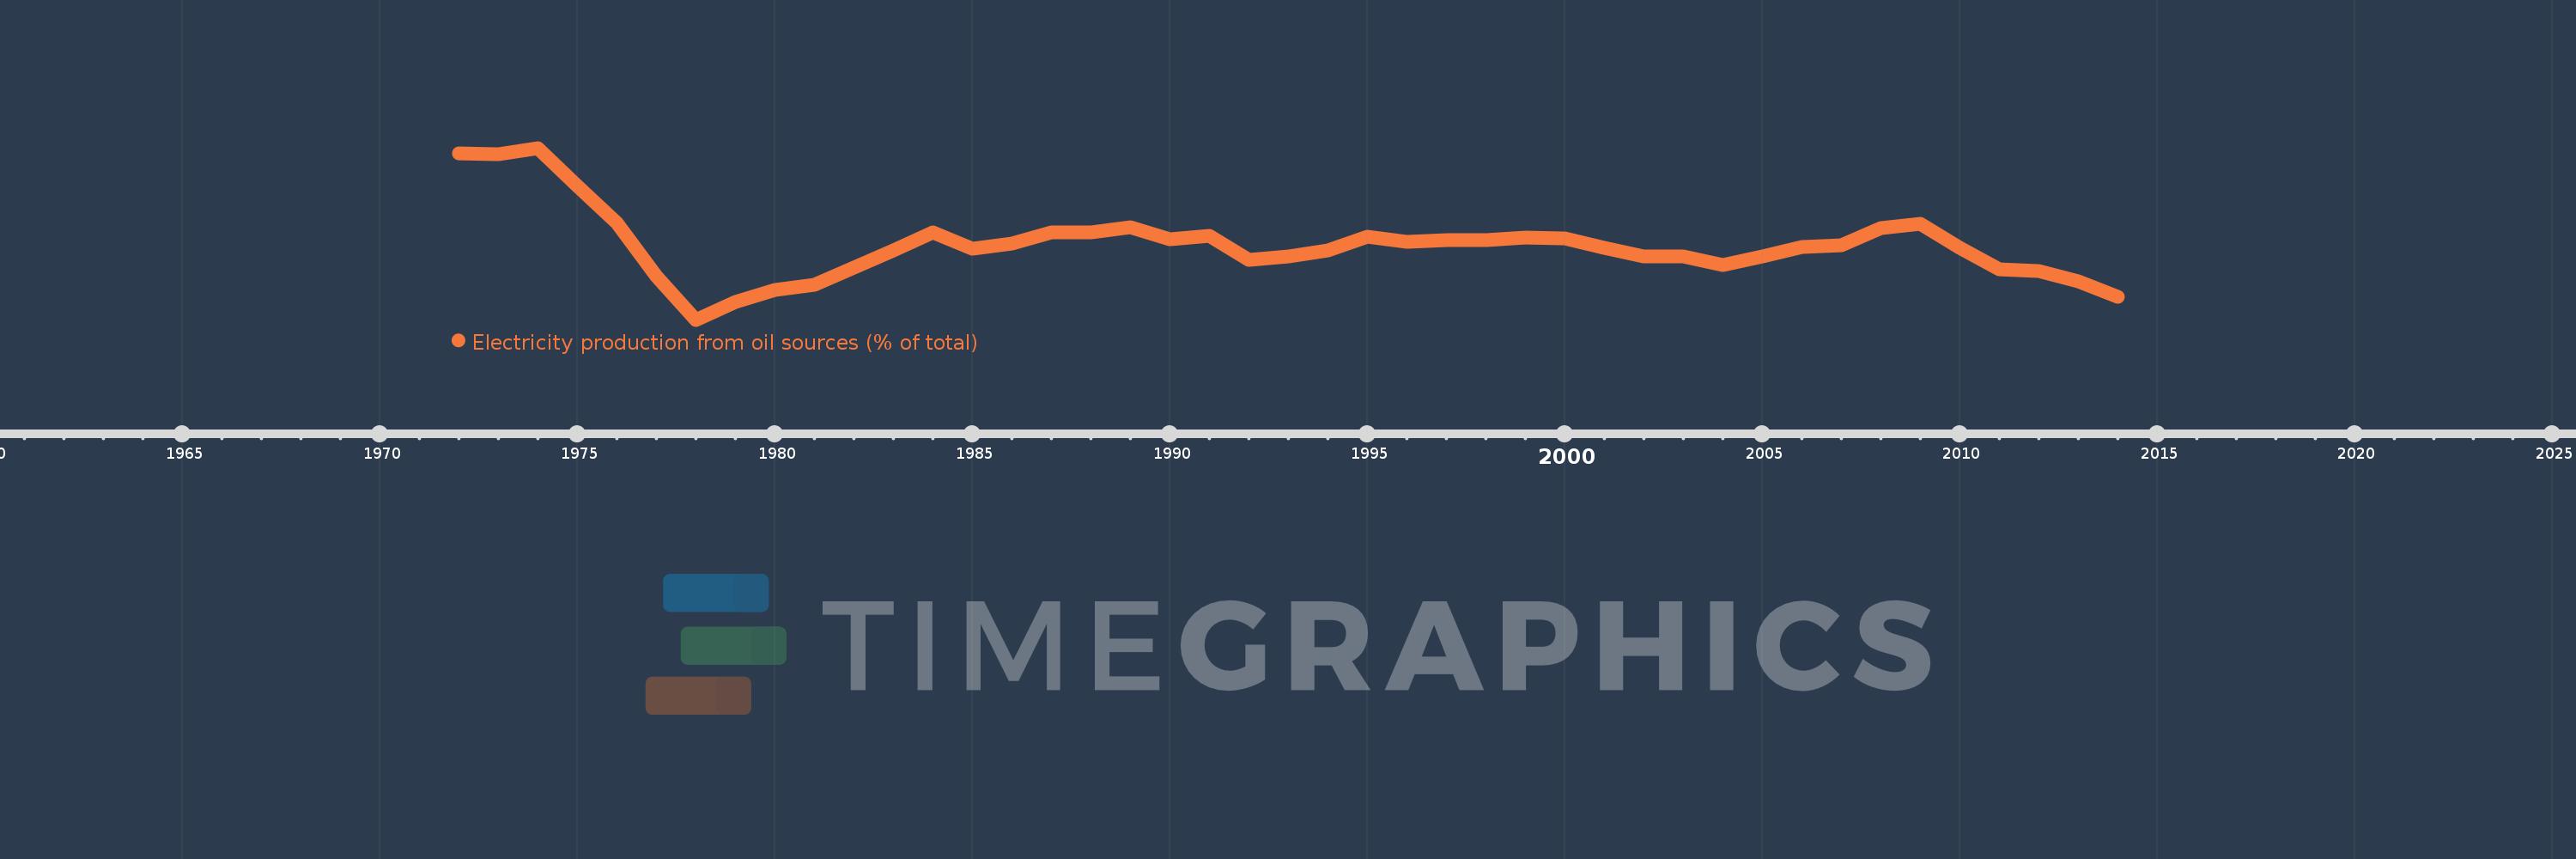
Electricity production from oil sources (% of total)
2014,2013,2012,2011,2010,2009,2008,2007,2006,2005,2004,2003,2002,2001,2000,1999,1998,1997,1996,1995,1994,1993,1992,1991,1990,1989,1988,1987,1986,1985,1984,1983,1982,1981,1980,1979,1978,1977,1976,1975,1974,1973,1972
This statistics in other country:
AlbaniaAlgeriaAngolaArab WorldArgentinaArmeniaAustraliaAustriaAzerbaijanBahrainBangladeshBelarusBelgiumBeninBoliviaBosnia and HerzegovinaBotswanaBrazilBrunei DarussalamBulgariaCambodiaCameroonCanadaCentral Europe and the BalticsChileChinaColombiaCongo, Dem. Rep.Congo, Rep.Costa RicaCote d'IvoireCroatiaCubaCuracaoCyprusCzech RepublicDenmarkDominican RepublicEarly-demographic dividendEast Asia & PacificEast Asia & Pacific (excluding high income)East Asia & Pacific (IDA & IBRD countries)EcuadorEgypt, Arab Rep.El SalvadorEritreaEstoniaEthiopiaEuro areaEurope & Central AsiaEurope & Central Asia (excluding high income)Europe & Central Asia (IDA & IBRD countries)European UnionFinlandFragile and conflict affected situationsFranceGabonGeorgiaGermanyGhanaGibraltarGreeceGuatemalaHaitiHeavily indebted poor countries (HIPC)High incomeHondurasHong Kong SAR, ChinaHungaryIBRD onlyIcelandIDA & IBRD totalIDA blendIDA onlyIDA totalIndiaIndonesiaIran, Islamic Rep.IraqIrelandIsraelItalyJamaicaJapanJordanKazakhstanKenyaKorea, Dem. People’s Rep.Korea, Rep.KosovoKuwaitKyrgyz RepublicLate-demographic dividendLatin America & Caribbean Latin America & Caribbean (excluding high income)Latin America & the Caribbean (IDA & IBRD countries)LatviaLeast developed countries: UN classificationLebanonLibyaLithuaniaLow & middle incomeLower middle incomeLuxembourgMacedonia, FYRMalaysiaMaltaMauritiusMexicoMiddle East & North AfricaMiddle East & North Africa (excluding high income)Middle East & North Africa (IDA & IBRD countries)Middle incomeMoldovaMongoliaMontenegroMoroccoMozambiqueMyanmarNamibiaNepalNetherlandsNew ZealandNicaraguaNigerNigeriaNorth AmericaNorwayOECD membersOmanOther small statesPakistanPanamaParaguayPeruPhilippinesPolandPortugalPost-demographic dividendPre-demographic dividendQatarRomaniaRussian FederationSaudi ArabiaSenegalSerbiaSingaporeSlovak RepublicSloveniaSmall statesSouth AfricaSouth AsiaSouth Asia (IDA & IBRD)South SudanSpainSri LankaSub-Saharan Africa Sub-Saharan Africa (excluding high income)Sub-Saharan Africa (IDA & IBRD countries)SudanSwedenSwitzerlandSyrian Arab RepublicTajikistanTanzaniaThailandTogoTrinidad and TobagoTunisiaTurkeyTurkmenistanUkraineUnited Arab EmiratesUnited KingdomUnited StatesUpper middle incomeUruguayUzbekistanVenezuela, RBVietnamWorldYemen, Rep.ZambiaZimbabwe Timeline:
This timeline shows a graph from 1972 to 2014 of Syrian Arab Republic. No data until 1971. Number of actual observations by date: 43.
Source name:
World Development Indicators
Source organization:
IEA Statistics © OECD/IEA 2014 (http://www.iea.org/stats/index.asp), subject to https://www.iea.org/t&c/termsandconditions/
Categories, topics:
Energy & Mining, Climate Change, Infrastructure
Last updated:
apr 23, 2017
Indicators value changes by year
Minimum:
14.929
jan 1, 1978
Maximum:
98.805
jan 1, 1974
At the date of observation
Value
Absolute change
Change from previous value
jan 1, 1972
96.208
+96.208
0.0%
jan 1, 1973
95.897
-0.311
-0.32%
jan 1, 1974
98.805
+2.909
3.03%
jan 1, 1975
80.427
-18.378
-18.6%
jan 1, 1976
62.33
-18.097
-22.5%
jan 1, 1977
36.232
-26.099
-41.87%
jan 1, 1978
14.929
-21.302
-58.79%
jan 1, 1979
23.685
+8.756
58.65%
jan 1, 1980
29.313
+5.628
23.76%
jan 1, 1981
31.944
+2.631
8.98%
jan 1, 1982
40.591
+8.647
27.07%
jan 1, 1983
48.684
+8.093
19.94%
jan 1, 1984
57.589
+8.904
18.29%
jan 1, 1985
49.535
-8.054
-13.98%
jan 1, 1986
52.203
+2.668
5.39%
jan 1, 1987
57.63
+5.427
10.4%
jan 1, 1988
57.692
+0.062
0.11%
jan 1, 1989
60.131
+2.439
4.23%
jan 1, 1990
54.405
-5.726
-9.52%
jan 1, 1991
55.964
+1.56
2.87%
jan 1, 1992
44.257
-11.708
-20.92%
jan 1, 1993
45.789
+1.532
3.46%
jan 1, 1994
48.94
+3.151
6.88%
jan 1, 1995
55.651
+6.712
13.71%
jan 1, 1996
53.171
-2.481
-4.46%
jan 1, 1997
53.912
+0.741
1.39%
jan 1, 1998
53.762
-0.15
-0.28%
jan 1, 1999
54.927
+1.165
2.17%
jan 1, 2000
54.498
-0.429
-0.78%
jan 1, 2001
50.085
-4.413
-8.1%
jan 1, 2002
45.867
-4.218
-8.42%
jan 1, 2003
45.761
-0.106
-0.23%
jan 1, 2004
41.777
-3.984
-8.71%
jan 1, 2005
45.802
+4.025
9.64%
jan 1, 2006
50.508
+4.706
10.27%
jan 1, 2007
51.367
+0.858
1.7%
jan 1, 2008
59.764
+8.397
16.35%
jan 1, 2009
61.685
+1.921
3.21%
jan 1, 2010
50.016
-11.669
-18.92%
jan 1, 2011
39.446
-10.57
-21.13%
jan 1, 2012
38.833
-0.613
-1.55%
jan 1, 2013
33.497
-5.336
-13.74%
jan 1, 2014
26.256
-7.241
-21.62%
Ranking of countries by current statistics by years


Comments: