29
/
en
AIzaSyAYiBZKx7MnpbEhh9jyipgxe19OcubqV5w
April 1, 2024
144248
Guatemala
GTM
true
2
1
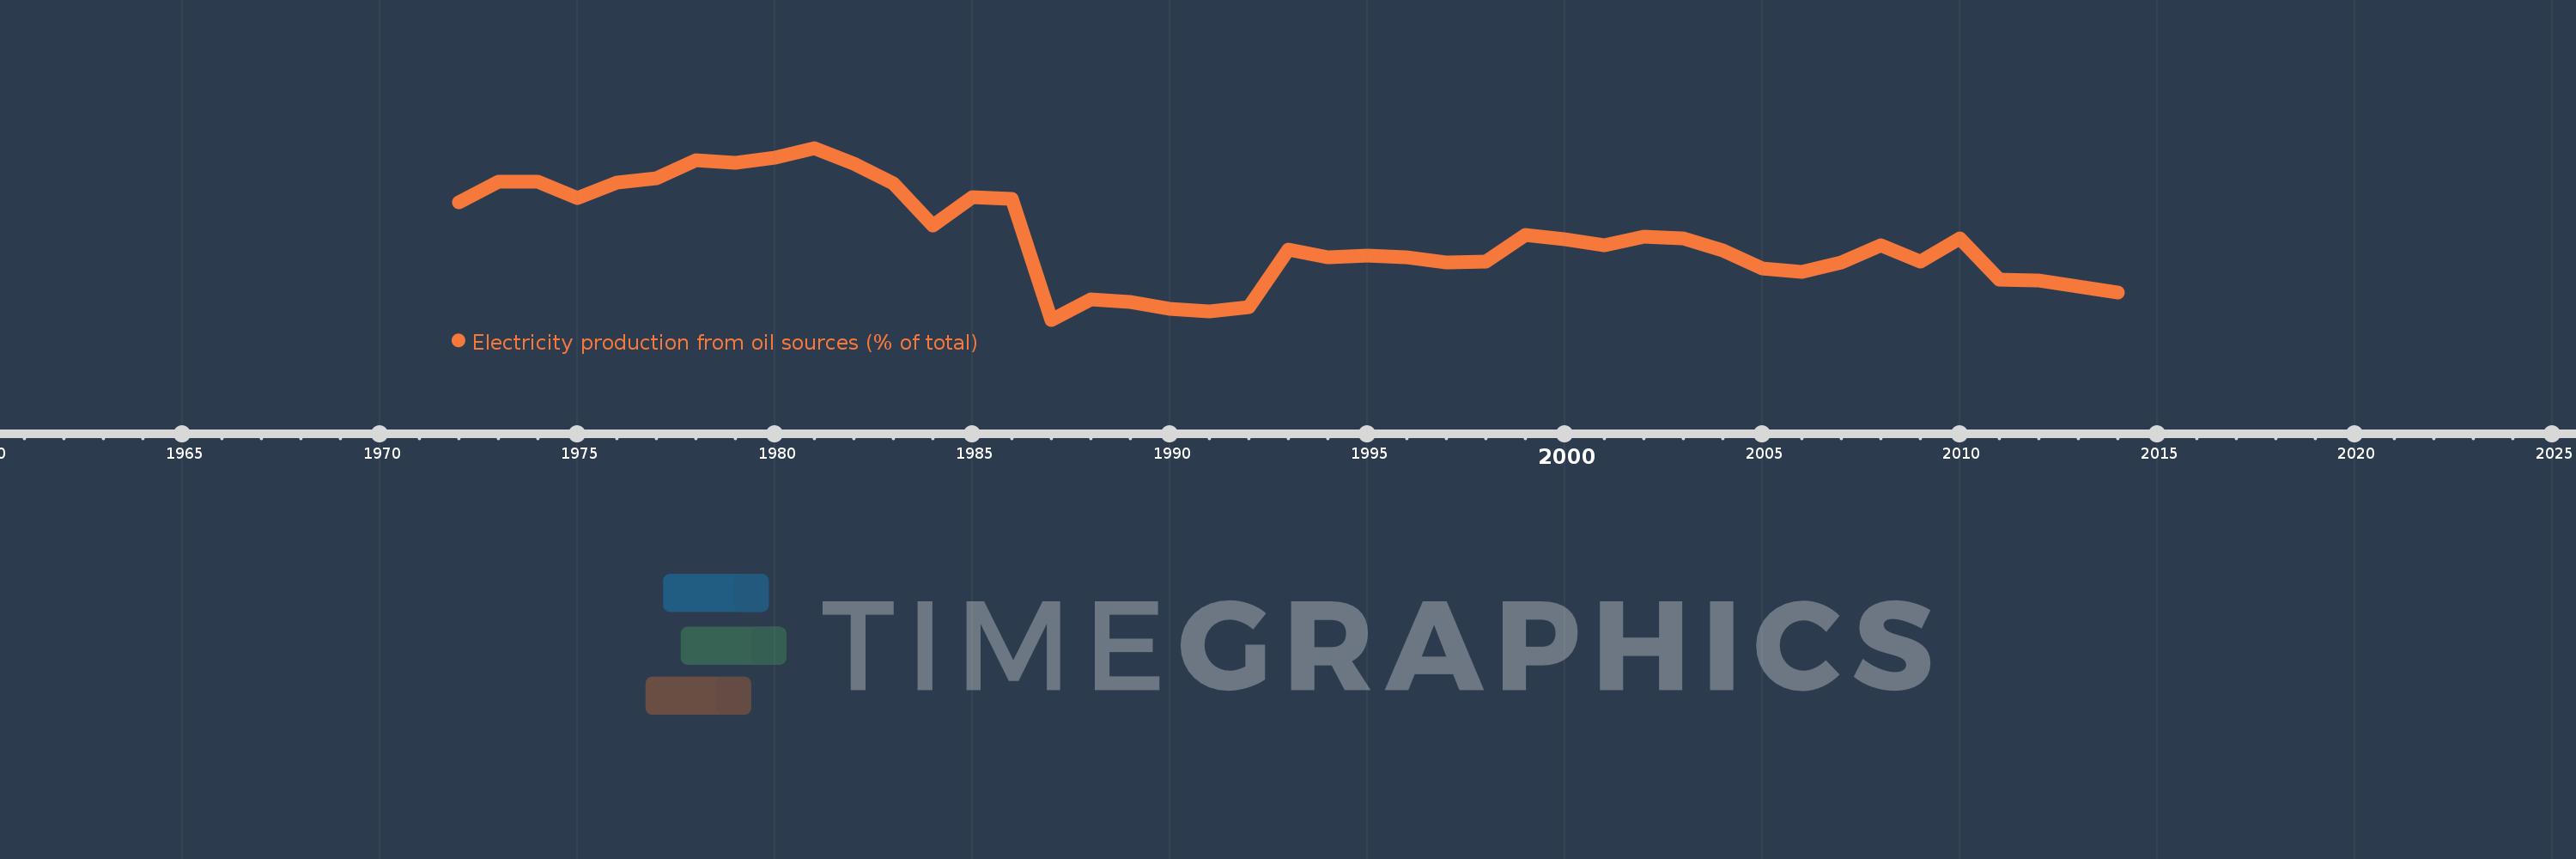
Electricity production from oil sources (% of total)
2014,2013,2012,2011,2010,2009,2008,2007,2006,2005,2004,2003,2002,2001,2000,1999,1998,1997,1996,1995,1994,1993,1992,1991,1990,1989,1988,1987,1986,1985,1984,1983,1982,1981,1980,1979,1978,1977,1976,1975,1974,1973,1972
This statistics in other country:
AlbaniaAlgeriaAngolaArab WorldArgentinaArmeniaAustraliaAustriaAzerbaijanBahrainBangladeshBelarusBelgiumBeninBoliviaBosnia and HerzegovinaBotswanaBrazilBrunei DarussalamBulgariaCambodiaCameroonCanadaCentral Europe and the BalticsChileChinaColombiaCongo, Dem. Rep.Congo, Rep.Costa RicaCote d'IvoireCroatiaCubaCuracaoCyprusCzech RepublicDenmarkDominican RepublicEarly-demographic dividendEast Asia & PacificEast Asia & Pacific (excluding high income)East Asia & Pacific (IDA & IBRD countries)EcuadorEgypt, Arab Rep.El SalvadorEritreaEstoniaEthiopiaEuro areaEurope & Central AsiaEurope & Central Asia (excluding high income)Europe & Central Asia (IDA & IBRD countries)European UnionFinlandFragile and conflict affected situationsFranceGabonGeorgiaGermanyGhanaGibraltarGreeceGuatemalaHaitiHeavily indebted poor countries (HIPC)High incomeHondurasHong Kong SAR, ChinaHungaryIBRD onlyIcelandIDA & IBRD totalIDA blendIDA onlyIDA totalIndiaIndonesiaIran, Islamic Rep.IraqIrelandIsraelItalyJamaicaJapanJordanKazakhstanKenyaKorea, Dem. People’s Rep.Korea, Rep.KosovoKuwaitKyrgyz RepublicLate-demographic dividendLatin America & Caribbean Latin America & Caribbean (excluding high income)Latin America & the Caribbean (IDA & IBRD countries)LatviaLeast developed countries: UN classificationLebanonLibyaLithuaniaLow & middle incomeLower middle incomeLuxembourgMacedonia, FYRMalaysiaMaltaMauritiusMexicoMiddle East & North AfricaMiddle East & North Africa (excluding high income)Middle East & North Africa (IDA & IBRD countries)Middle incomeMoldovaMongoliaMontenegroMoroccoMozambiqueMyanmarNamibiaNepalNetherlandsNew ZealandNicaraguaNigerNigeriaNorth AmericaNorwayOECD membersOmanOther small statesPakistanPanamaParaguayPeruPhilippinesPolandPortugalPost-demographic dividendPre-demographic dividendQatarRomaniaRussian FederationSaudi ArabiaSenegalSerbiaSingaporeSlovak RepublicSloveniaSmall statesSouth AfricaSouth AsiaSouth Asia (IDA & IBRD)South SudanSpainSri LankaSub-Saharan Africa Sub-Saharan Africa (excluding high income)Sub-Saharan Africa (IDA & IBRD countries)SudanSwedenSwitzerlandSyrian Arab RepublicTajikistanTanzaniaThailandTogoTrinidad and TobagoTunisiaTurkeyTurkmenistanUkraineUnited Arab EmiratesUnited KingdomUnited StatesUpper middle incomeUruguayUzbekistanVenezuela, RBVietnamWorldYemen, Rep.ZambiaZimbabwe Timeline:
This timeline shows a graph from 1972 to 2014 of Guatemala. No data until 1971. Number of actual observations by date: 43.
Source name:
World Development Indicators
Source organization:
IEA Statistics © OECD/IEA 2014 (http://www.iea.org/stats/index.asp), subject to https://www.iea.org/t&c/termsandconditions/
Categories, topics:
Energy & Mining, Climate Change, Infrastructure
Last updated:
apr 23, 2017
Indicators value changes by year
Maximum:
85.348
jan 1, 1981
At the date of observation
Value
Absolute change
Change from previous value
jan 1, 1972
59.607
+59.607
0.0%
jan 1, 1973
69.524
+9.917
16.64%
jan 1, 1974
69.604
+0.08
0.11%
jan 1, 1975
61.899
-7.705
-11.07%
jan 1, 1976
69.052
+7.153
11.56%
jan 1, 1977
71.15
+2.098
3.04%
jan 1, 1978
79.59
+8.441
11.86%
jan 1, 1979
78.482
-1.109
-1.39%
jan 1, 1980
80.678
+2.196
2.8%
jan 1, 1981
85.348
+4.671
5.79%
jan 1, 1982
77.927
-7.422
-8.7%
jan 1, 1983
68.773
-9.153
-11.75%
jan 1, 1984
48.607
-20.166
-29.32%
jan 1, 1985
62.123
+13.516
27.81%
jan 1, 1986
61.233
-0.89
-1.43%
jan 1, 1987
4.266
-56.967
-93.03%
jan 1, 1988
13.797
+9.531
223.4%
jan 1, 1989
12.554
-1.243
-9.01%
jan 1, 1990
9.295
-3.26
-25.97%
jan 1, 1991
8.371
-0.923
-9.93%
jan 1, 1992
10.411
+2.04
24.37%
jan 1, 1993
37.249
+26.838
257.78%
jan 1, 1994
33.727
-3.521
-9.45%
jan 1, 1995
34.733
+1.006
2.98%
jan 1, 1996
33.56
-1.173
-3.38%
jan 1, 1997
31.356
-2.204
-6.57%
jan 1, 1998
31.778
+0.422
1.35%
jan 1, 1999
44.277
+12.5
39.34%
jan 1, 2000
42.254
-2.024
-4.57%
jan 1, 2001
39.368
-2.885
-6.83%
jan 1, 2002
43.452
+4.084
10.37%
jan 1, 2003
42.465
-0.987
-2.27%
jan 1, 2004
37.081
-5.384
-12.68%
jan 1, 2005
28.384
-8.697
-23.45%
jan 1, 2006
26.649
-1.735
-6.11%
jan 1, 2007
31.19
+4.541
17.04%
jan 1, 2008
39.481
+8.291
26.58%
jan 1, 2009
31.521
-7.961
-20.16%
jan 1, 2010
42.788
+11.267
35.74%
jan 1, 2011
22.996
-19.792
-46.26%
jan 1, 2012
22.601
-0.395
-1.72%
jan 1, 2013
19.964
-2.637
-11.67%
jan 1, 2014
17.046
-2.918
-14.61%
Ranking of countries by current statistics by years


Comments: