29
/
en
AIzaSyAYiBZKx7MnpbEhh9jyipgxe19OcubqV5w
April 1, 2024
53336
Other small states
OSS
false
2
1
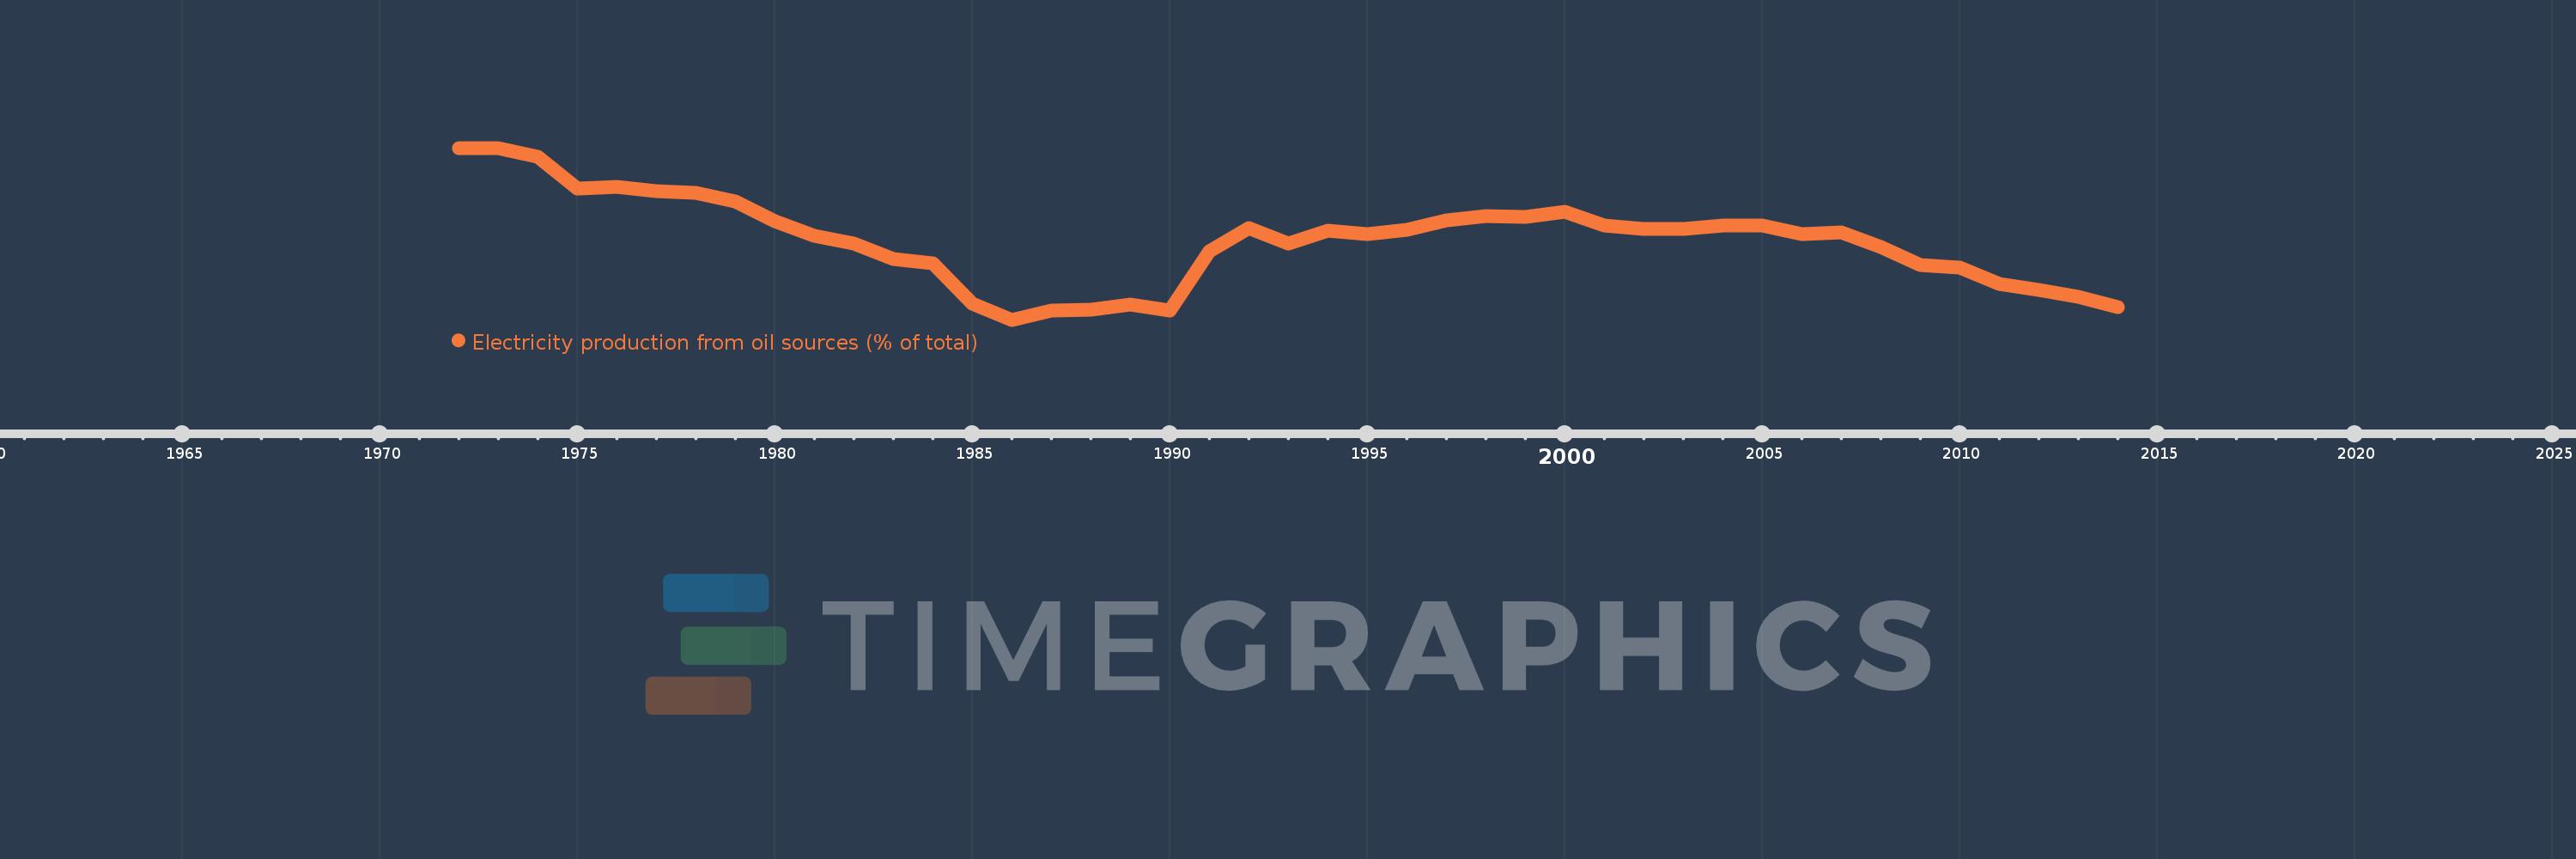
Electricity production from oil sources (% of total)
2014,2013,2012,2011,2010,2009,2008,2007,2006,2005,2004,2003,2002,2001,2000,1999,1998,1997,1996,1995,1994,1993,1992,1991,1990,1989,1988,1987,1986,1985,1984,1983,1982,1981,1980,1979,1978,1977,1976,1975,1974,1973,1972
This statistics in other country:
AlbaniaAlgeriaAngolaArab WorldArgentinaArmeniaAustraliaAustriaAzerbaijanBahrainBangladeshBelarusBelgiumBeninBoliviaBosnia and HerzegovinaBotswanaBrazilBrunei DarussalamBulgariaCambodiaCameroonCanadaCentral Europe and the BalticsChileChinaColombiaCongo, Dem. Rep.Congo, Rep.Costa RicaCote d'IvoireCroatiaCubaCuracaoCyprusCzech RepublicDenmarkDominican RepublicEarly-demographic dividendEast Asia & PacificEast Asia & Pacific (excluding high income)East Asia & Pacific (IDA & IBRD countries)EcuadorEgypt, Arab Rep.El SalvadorEritreaEstoniaEthiopiaEuro areaEurope & Central AsiaEurope & Central Asia (excluding high income)Europe & Central Asia (IDA & IBRD countries)European UnionFinlandFragile and conflict affected situationsFranceGabonGeorgiaGermanyGhanaGibraltarGreeceGuatemalaHaitiHeavily indebted poor countries (HIPC)High incomeHondurasHong Kong SAR, ChinaHungaryIBRD onlyIcelandIDA & IBRD totalIDA blendIDA onlyIDA totalIndiaIndonesiaIran, Islamic Rep.IraqIrelandIsraelItalyJamaicaJapanJordanKazakhstanKenyaKorea, Dem. People’s Rep.Korea, Rep.KosovoKuwaitKyrgyz RepublicLate-demographic dividendLatin America & Caribbean Latin America & Caribbean (excluding high income)Latin America & the Caribbean (IDA & IBRD countries)LatviaLeast developed countries: UN classificationLebanonLibyaLithuaniaLow & middle incomeLower middle incomeLuxembourgMacedonia, FYRMalaysiaMaltaMauritiusMexicoMiddle East & North AfricaMiddle East & North Africa (excluding high income)Middle East & North Africa (IDA & IBRD countries)Middle incomeMoldovaMongoliaMontenegroMoroccoMozambiqueMyanmarNamibiaNepalNetherlandsNew ZealandNicaraguaNigerNigeriaNorth AmericaNorwayOECD membersOmanOther small statesPakistanPanamaParaguayPeruPhilippinesPolandPortugalPost-demographic dividendPre-demographic dividendQatarRomaniaRussian FederationSaudi ArabiaSenegalSerbiaSingaporeSlovak RepublicSloveniaSmall statesSouth AfricaSouth AsiaSouth Asia (IDA & IBRD)South SudanSpainSri LankaSub-Saharan Africa Sub-Saharan Africa (excluding high income)Sub-Saharan Africa (IDA & IBRD countries)SudanSwedenSwitzerlandSyrian Arab RepublicTajikistanTanzaniaThailandTogoTrinidad and TobagoTunisiaTurkeyTurkmenistanUkraineUnited Arab EmiratesUnited KingdomUnited StatesUpper middle incomeUruguayUzbekistanVenezuela, RBVietnamWorldYemen, Rep.ZambiaZimbabwe Timeline:
This timeline shows a graph from 1972 to 2014 of Other small states. No data until 1971. Number of actual observations by date: 43.
Source name:
World Development Indicators
Source organization:
IEA Statistics © OECD/IEA 2014 (http://www.iea.org/stats/index.asp), subject to https://www.iea.org/t&c/termsandconditions/
Categories, topics:
Energy & Mining, Climate Change, Infrastructure
Last updated:
apr 23, 2017
Indicators value changes by year
Maximum:
15.246
jan 1, 1973
At the date of observation
Value
Absolute change
Change from previous value
jan 1, 1972
15.215
+15.215
0.0%
jan 1, 1973
15.246
+0.03
0.2%
jan 1, 1974
14.738
-0.508
-3.33%
jan 1, 1975
12.944
-1.794
-12.17%
jan 1, 1976
13.08
+0.137
1.05%
jan 1, 1977
12.836
-0.244
-1.87%
jan 1, 1978
12.739
-0.097
-0.76%
jan 1, 1979
12.25
-0.489
-3.84%
jan 1, 1980
11.141
-1.11
-9.06%
jan 1, 1981
10.299
-0.841
-7.55%
jan 1, 1982
9.885
-0.414
-4.02%
jan 1, 1983
9.011
-0.874
-8.84%
jan 1, 1984
8.788
-0.223
-2.48%
jan 1, 1985
6.491
-2.297
-26.14%
jan 1, 1986
5.61
-0.881
-13.57%
jan 1, 1987
6.12
+0.51
9.09%
jan 1, 1988
6.152
+0.032
0.53%
jan 1, 1989
6.454
+0.302
4.91%
jan 1, 1990
6.116
-0.338
-5.23%
jan 1, 1991
9.452
+3.336
54.55%
jan 1, 1992
10.77
+1.317
13.94%
jan 1, 1993
9.9
-0.87
-8.08%
jan 1, 1994
10.591
+0.691
6.98%
jan 1, 1995
10.433
-0.157
-1.49%
jan 1, 1996
10.643
+0.21
2.01%
jan 1, 1997
11.179
+0.536
5.04%
jan 1, 1998
11.409
+0.23
2.06%
jan 1, 1999
11.399
-0.01
-0.09%
jan 1, 2000
11.666
+0.267
2.34%
jan 1, 2001
10.919
-0.748
-6.41%
jan 1, 2002
10.702
-0.217
-1.99%
jan 1, 2003
10.72
+0.018
0.17%
jan 1, 2004
10.881
+0.161
1.5%
jan 1, 2005
10.907
+0.025
0.23%
jan 1, 2006
10.419
-0.488
-4.47%
jan 1, 2007
10.501
+0.082
0.79%
jan 1, 2008
9.709
-0.793
-7.55%
jan 1, 2009
8.678
-1.031
-10.62%
jan 1, 2010
8.524
-0.154
-1.78%
jan 1, 2011
7.631
-0.893
-10.48%
jan 1, 2012
7.259
-0.372
-4.87%
jan 1, 2013
6.912
-0.347
-4.78%
jan 1, 2014
6.318
-0.594
-8.6%
Ranking of countries by current statistics by years


Comments: