29
/
en
AIzaSyAYiBZKx7MnpbEhh9jyipgxe19OcubqV5w
April 1, 2024
100989
Canada
CAN
true
2
1
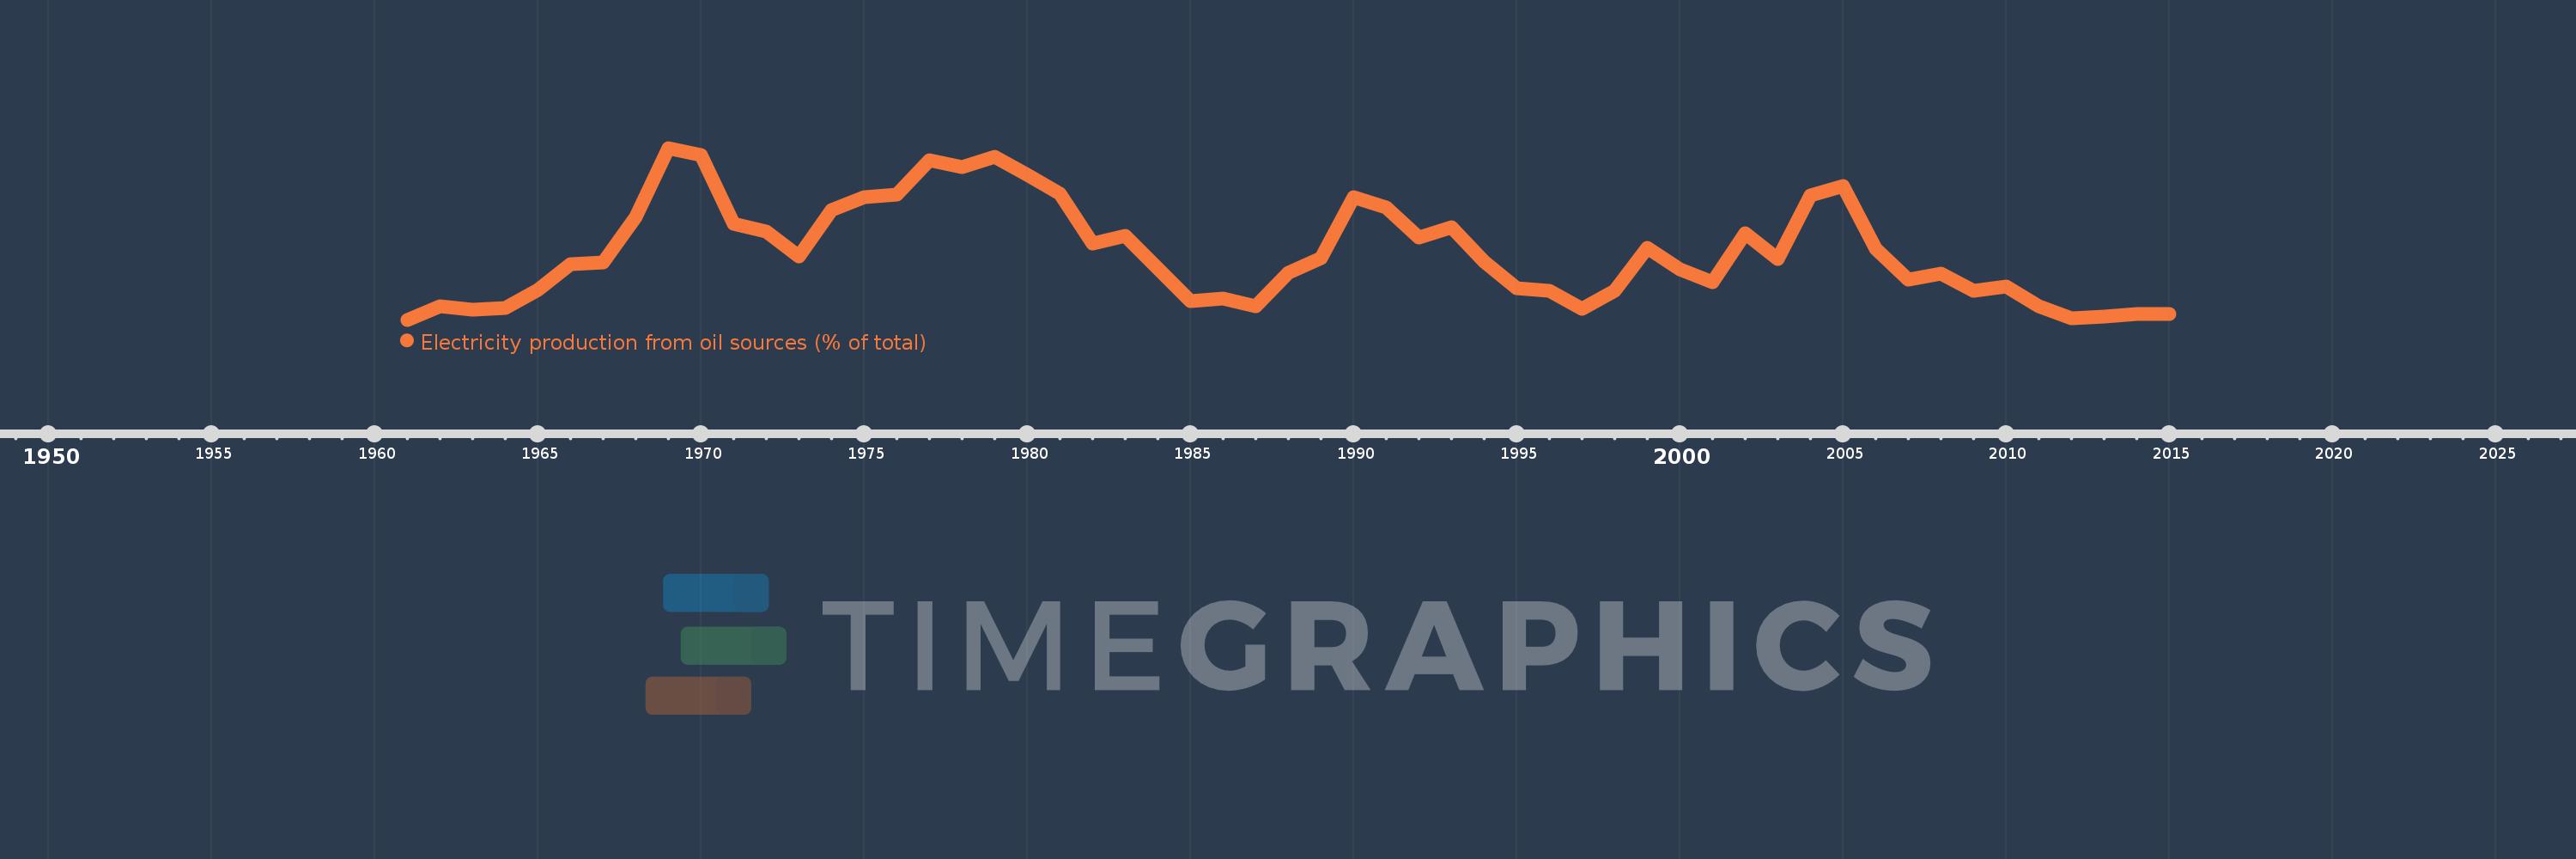
Electricity production from oil sources (% of total)
2015,2014,2013,2012,2011,2010,2009,2008,2007,2006,2005,2004,2003,2002,2001,2000,1999,1998,1997,1996,1995,1994,1993,1992,1991,1990,1989,1988,1987,1986,1985,1984,1983,1982,1981,1980,1979,1978,1977,1976,1975,1974,1973,1972,1971,1970,1969,1968,1967,1966,1965,1964,1963,1962,1961
This statistics in other country:
AlbaniaAlgeriaAngolaArab WorldArgentinaArmeniaAustraliaAustriaAzerbaijanBahrainBangladeshBelarusBelgiumBeninBoliviaBosnia and HerzegovinaBotswanaBrazilBrunei DarussalamBulgariaCambodiaCameroonCanadaCentral Europe and the BalticsChileChinaColombiaCongo, Dem. Rep.Congo, Rep.Costa RicaCote d'IvoireCroatiaCubaCuracaoCyprusCzech RepublicDenmarkDominican RepublicEarly-demographic dividendEast Asia & PacificEast Asia & Pacific (excluding high income)East Asia & Pacific (IDA & IBRD countries)EcuadorEgypt, Arab Rep.El SalvadorEritreaEstoniaEthiopiaEuro areaEurope & Central AsiaEurope & Central Asia (excluding high income)Europe & Central Asia (IDA & IBRD countries)European UnionFinlandFragile and conflict affected situationsFranceGabonGeorgiaGermanyGhanaGibraltarGreeceGuatemalaHaitiHeavily indebted poor countries (HIPC)High incomeHondurasHong Kong SAR, ChinaHungaryIBRD onlyIcelandIDA & IBRD totalIDA blendIDA onlyIDA totalIndiaIndonesiaIran, Islamic Rep.IraqIrelandIsraelItalyJamaicaJapanJordanKazakhstanKenyaKorea, Dem. People’s Rep.Korea, Rep.KosovoKuwaitKyrgyz RepublicLate-demographic dividendLatin America & Caribbean Latin America & Caribbean (excluding high income)Latin America & the Caribbean (IDA & IBRD countries)LatviaLeast developed countries: UN classificationLebanonLibyaLithuaniaLow & middle incomeLower middle incomeLuxembourgMacedonia, FYRMalaysiaMaltaMauritiusMexicoMiddle East & North AfricaMiddle East & North Africa (excluding high income)Middle East & North Africa (IDA & IBRD countries)Middle incomeMoldovaMongoliaMontenegroMoroccoMozambiqueMyanmarNamibiaNepalNetherlandsNew ZealandNicaraguaNigerNigeriaNorth AmericaNorwayOECD membersOmanOther small statesPakistanPanamaParaguayPeruPhilippinesPolandPortugalPost-demographic dividendPre-demographic dividendQatarRomaniaRussian FederationSaudi ArabiaSenegalSerbiaSingaporeSlovak RepublicSloveniaSmall statesSouth AfricaSouth AsiaSouth Asia (IDA & IBRD)South SudanSpainSri LankaSub-Saharan Africa Sub-Saharan Africa (excluding high income)Sub-Saharan Africa (IDA & IBRD countries)SudanSwedenSwitzerlandSyrian Arab RepublicTajikistanTanzaniaThailandTogoTrinidad and TobagoTunisiaTurkeyTurkmenistanUkraineUnited Arab EmiratesUnited KingdomUnited StatesUpper middle incomeUruguayUzbekistanVenezuela, RBVietnamWorldYemen, Rep.ZambiaZimbabwe Timeline:
This timeline shows a graph from 1961 to 2015 of Canada. No data until 1960. Number of actual observations by date: 55.
Source name:
World Development Indicators
Source organization:
IEA Statistics © OECD/IEA 2014 (http://www.iea.org/stats/index.asp), subject to https://www.iea.org/t&c/termsandconditions/
Categories, topics:
Energy & Mining, Climate Change, Infrastructure
Last updated:
apr 23, 2017
Indicators value changes by year
At the date of observation
Value
Absolute change
Change from previous value
jan 1, 1961
1.029
+1.029
0.0%
jan 1, 1962
1.309
+0.28
27.22%
jan 1, 1963
1.251
-0.058
-4.4%
jan 1, 1964
1.284
+0.033
2.61%
jan 1, 1965
1.668
+0.385
29.96%
jan 1, 1966
2.201
+0.533
31.93%
jan 1, 1967
2.243
+0.042
1.89%
jan 1, 1968
3.218
+0.976
43.5%
jan 1, 1969
4.676
+1.458
45.31%
jan 1, 1970
4.527
-0.149
-3.19%
jan 1, 1971
3.059
-1.468
-32.43%
jan 1, 1972
2.895
-0.164
-5.36%
jan 1, 1973
2.381
-0.514
-17.74%
jan 1, 1974
3.358
+0.976
41.0%
jan 1, 1975
3.628
+0.271
8.06%
jan 1, 1976
3.683
+0.055
1.53%
jan 1, 1977
4.417
+0.734
19.92%
jan 1, 1978
4.278
-0.139
-3.15%
jan 1, 1979
4.481
+0.203
4.75%
jan 1, 1980
4.102
-0.379
-8.46%
jan 1, 1981
3.696
-0.405
-9.88%
jan 1, 1982
2.647
-1.049
-28.38%
jan 1, 1983
2.803
+0.156
5.89%
jan 1, 1984
2.116
-0.688
-24.53%
jan 1, 1985
1.43
-0.686
-32.41%
jan 1, 1986
1.477
+0.047
3.26%
jan 1, 1987
1.316
-0.161
-10.87%
jan 1, 1988
2.027
+0.711
54.04%
jan 1, 1989
2.341
+0.314
15.47%
jan 1, 1990
3.639
+1.298
55.43%
jan 1, 1991
3.416
-0.222
-6.11%
jan 1, 1992
2.78
-0.636
-18.63%
jan 1, 1993
2.997
+0.217
7.82%
jan 1, 1994
2.257
-0.741
-24.71%
jan 1, 1995
1.695
-0.562
-24.91%
jan 1, 1996
1.642
-0.052
-3.09%
jan 1, 1997
1.255
-0.387
-23.58%
jan 1, 1998
1.636
+0.381
30.38%
jan 1, 1999
2.561
+0.925
56.51%
jan 1, 2000
2.097
-0.464
-18.1%
jan 1, 2001
1.83
-0.267
-12.75%
jan 1, 2002
2.864
+1.035
56.55%
jan 1, 2003
2.311
-0.553
-19.31%
jan 1, 2004
3.661
+1.35
58.39%
jan 1, 2005
3.869
+0.209
5.7%
jan 1, 2006
2.536
-1.334
-34.47%
jan 1, 2007
1.875
-0.66
-26.04%
jan 1, 2008
2.009
+0.133
7.12%
jan 1, 2009
1.646
-0.362
-18.04%
jan 1, 2010
1.743
+0.097
5.89%
jan 1, 2011
1.311
-0.432
-24.79%
jan 1, 2012
1.051
-0.26
-19.82%
jan 1, 2013
1.094
+0.043
4.1%
jan 1, 2014
1.152
+0.058
5.3%
jan 1, 2015
1.147
-0.005
-0.45%
Ranking of countries by current statistics by years


Comments: