29
/
en
AIzaSyAYiBZKx7MnpbEhh9jyipgxe19OcubqV5w
April 1, 2024
74029
Austria
AUT
true
2
1
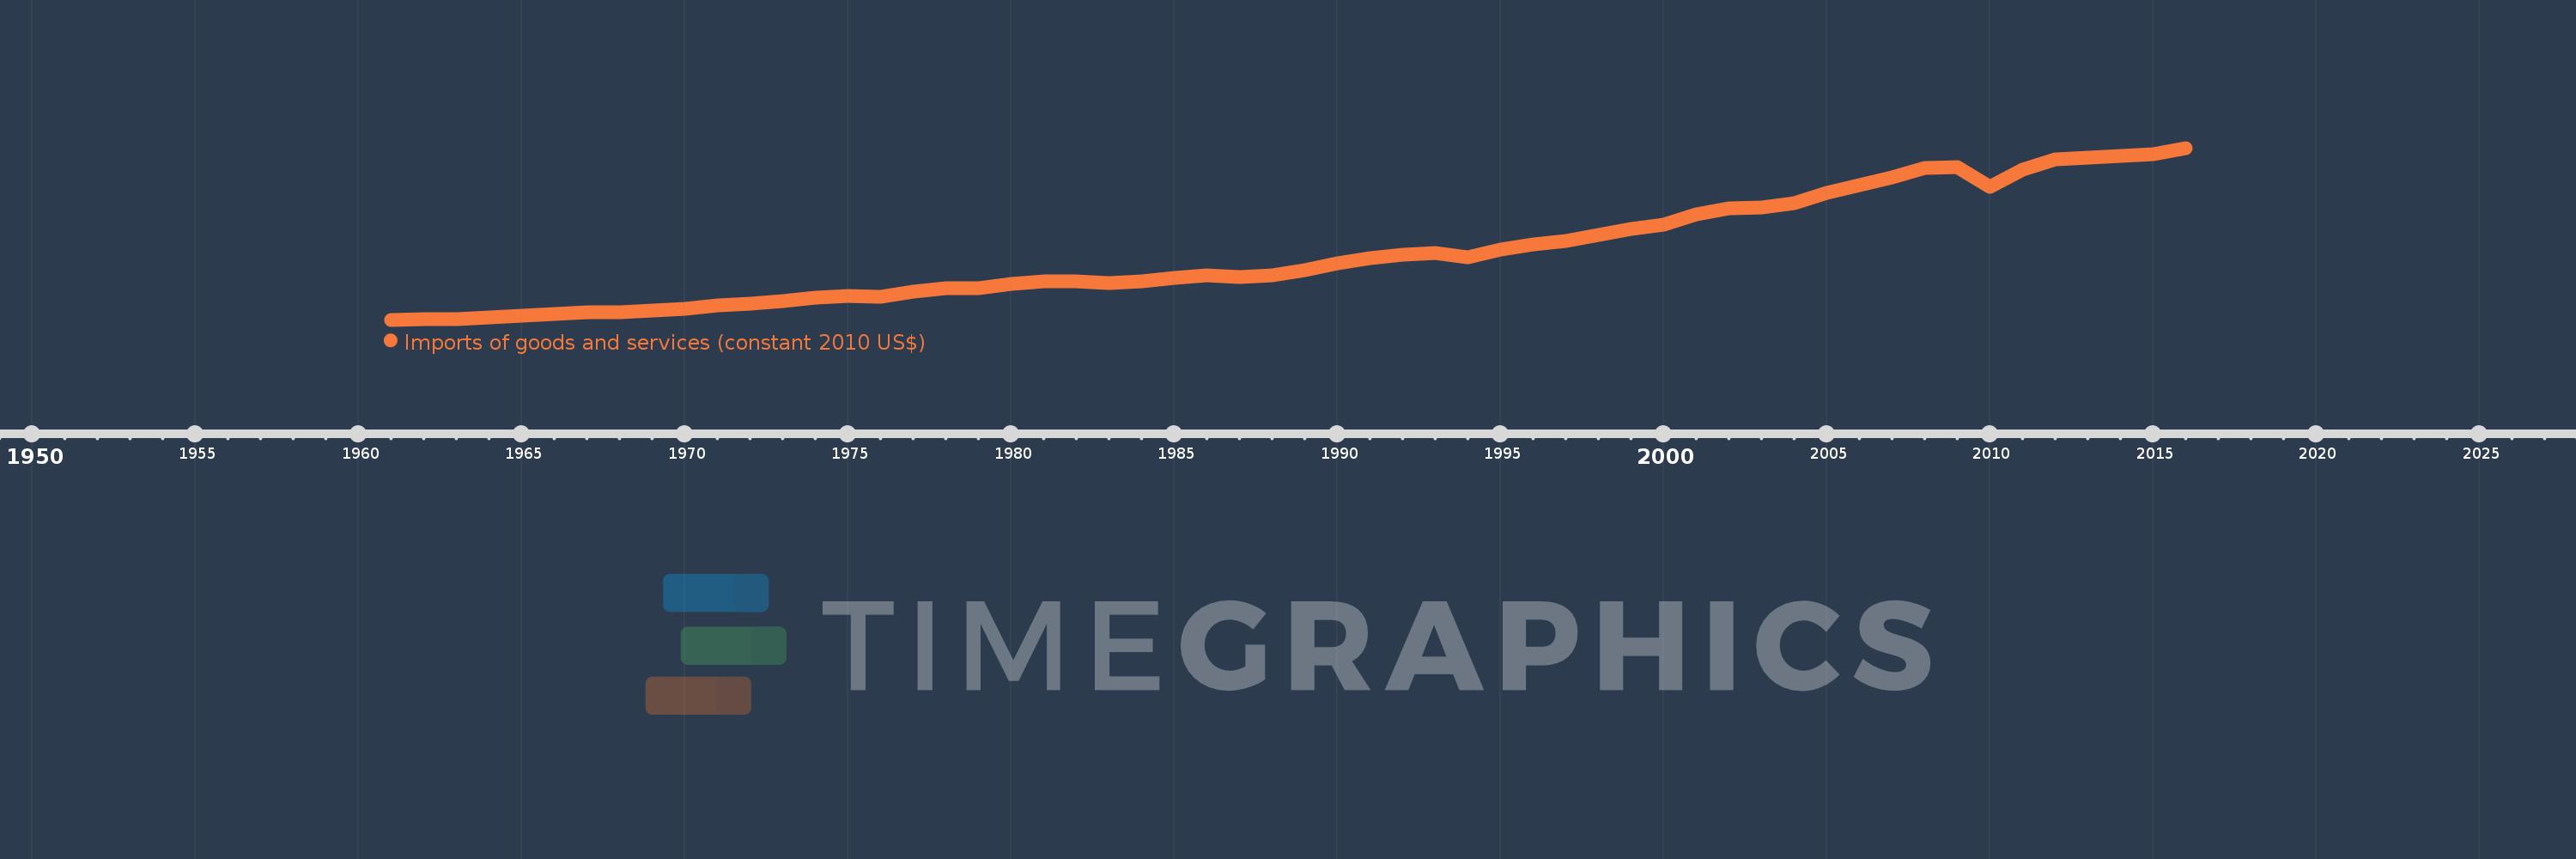
Imports of goods and services (constant 2010 US$)
2016,2015,2014,2013,2012,2011,2010,2009,2008,2007,2006,2005,2004,2003,2002,2001,2000,1999,1998,1997,1996,1995,1994,1993,1992,1991,1990,1989,1988,1987,1986,1985,1984,1983,1982,1981,1980,1979,1978,1977,1976,1975,1974,1973,1972,1971,1970,1969,1968,1967,1966,1965,1964,1963,1962,1961
This statistics in other country:
AfghanistanAlbaniaAlgeriaAngolaAntigua and BarbudaArab WorldArgentinaArmeniaArubaAustraliaAustriaAzerbaijanBahamas, TheBahrainBangladeshBarbadosBelarusBelgiumBelizeBeninBermudaBhutanBoliviaBosnia and HerzegovinaBotswanaBrazilBrunei DarussalamBulgariaBurkina FasoBurundiCabo VerdeCambodiaCameroonCanadaCaribbean small statesCentral African RepublicCentral Europe and the BalticsChadChileChinaColombiaComorosCongo, Dem. Rep.Congo, Rep.Costa RicaCote d'IvoireCroatiaCubaCyprusCzech RepublicDenmarkDominicaDominican RepublicEarly-demographic dividendEast Asia & PacificEast Asia & Pacific (excluding high income)East Asia & Pacific (IDA & IBRD countries)EcuadorEgypt, Arab Rep.El SalvadorEquatorial GuineaEritreaEstoniaEuro areaEurope & Central AsiaEurope & Central Asia (excluding high income)Europe & Central Asia (IDA & IBRD countries)European UnionFaroe IslandsFijiFinlandFragile and conflict affected situationsFranceGabonGambia, TheGeorgiaGermanyGhanaGreeceGrenadaGuatemalaGuineaGuinea-BissauGuyanaHaitiHeavily indebted poor countries (HIPC)High incomeHondurasHong Kong SAR, ChinaHungaryIBRD onlyIcelandIDA & IBRD totalIDA blendIDA onlyIDA totalIndiaIndonesiaIran, Islamic Rep.IraqIrelandIsraelItalyJamaicaJapanJordanKazakhstanKenyaKiribatiKorea, Rep.KosovoKuwaitKyrgyz RepublicLao PDRLate-demographic dividendLatin America & Caribbean Latin America & Caribbean (excluding high income)Latin America & the Caribbean (IDA & IBRD countries)LatviaLeast developed countries: UN classificationLebanonLiberiaLibyaLithuaniaLow & middle incomeLow incomeLower middle incomeLuxembourgMacao SAR, ChinaMacedonia, FYRMadagascarMalawiMalaysiaMaldivesMaliMaltaMauritaniaMauritiusMexicoMiddle East & North AfricaMiddle East & North Africa (excluding high income)Middle East & North Africa (IDA & IBRD countries)Middle incomeMoldovaMongoliaMontenegroMoroccoMozambiqueMyanmarNamibiaNepalNetherlandsNew ZealandNicaraguaNigerNigeriaNorth AmericaNorwayOECD membersOmanOther small statesPacific island small statesPakistanPalauPanamaParaguayPeruPhilippinesPolandPortugalPost-demographic dividendPre-demographic dividendPuerto RicoQatarRomaniaRussian FederationRwandaSamoaSaudi ArabiaSenegalSerbiaSeychellesSierra LeoneSingaporeSlovak RepublicSloveniaSmall statesSolomon IslandsSouth AfricaSouth AsiaSouth Asia (IDA & IBRD)South SudanSpainSri LankaSt. Kitts and NevisSt. LuciaSt. Vincent and the GrenadinesSub-Saharan Africa Sub-Saharan Africa (excluding high income)Sub-Saharan Africa (IDA & IBRD countries)SudanSurinameSwazilandSwedenSwitzerlandTajikistanTanzaniaThailandTimor-LesteTogoTongaTrinidad and TobagoTunisiaTurkeyTurkmenistanUgandaUkraineUnited Arab EmiratesUnited KingdomUnited StatesUpper middle incomeUruguayUzbekistanVanuatuVenezuela, RBVietnamWest Bank and GazaWorldYemen, Rep.ZambiaZimbabwe Timeline:
This timeline shows a graph from 1961 to 2016 of Austria. No data until 1960. Number of actual observations by date: 56.
Source name:
World Development Indicators
Source organization:
World Bank national accounts data, and OECD National Accounts data files.
Categories, topics:
Economy & Growth, Trade
Last updated:
apr 23, 2017
Indicators value changes by year
Minimum:
13.062 bln
jan 1, 1961
Maximum:
210.59 bln
jan 1, 2016
At the date of observation
Value
Absolute change
Change from previous value
jan 1, 1961
13.062 bln
+13.062 bln
0.0%
jan 1, 1962
13.304 bln
+242.443 mln
1.86%
jan 1, 1963
14.213 bln
+909.161 mln
6.83%
jan 1, 1964
15.668 bln
+1.455 bln
10.23%
jan 1, 1965
17.395 bln
+1.727 bln
11.03%
jan 1, 1966
19.244 bln
+1.849 bln
10.63%
jan 1, 1967
21.242 bln
+1.998 bln
10.38%
jan 1, 1968
21.722 bln
+480.105 mln
2.26%
jan 1, 1969
23.293 bln
+1.571 bln
7.23%
jan 1, 1970
25.393 bln
+2.1 bln
9.02%
jan 1, 1971
29.274 bln
+3.88 bln
15.28%
jan 1, 1972
31.114 bln
+1.841 bln
6.29%
jan 1, 1973
34.893 bln
+3.779 bln
12.15%
jan 1, 1974
38.227 bln
+3.333 bln
9.55%
jan 1, 1975
40.866 bln
+2.64 bln
6.91%
jan 1, 1976
38.967 bln
-1.9 bln
-4.65%
jan 1, 1977
45.754 bln
+6.787 bln
17.42%
jan 1, 1978
49.616 bln
+3.862 bln
8.44%
jan 1, 1979
49.116 bln
-500.277 mln
-1.01%
jan 1, 1980
54.148 bln
+5.032 bln
10.25%
jan 1, 1981
57.239 bln
+3.091 bln
5.71%
jan 1, 1982
56.892 bln
-347.056 mln
-0.61%
jan 1, 1983
54.827 bln
-2.065 bln
-3.63%
jan 1, 1984
57.117 bln
+2.29 bln
4.18%
jan 1, 1985
60.912 bln
+3.794 bln
6.64%
jan 1, 1986
64.285 bln
+3.373 bln
5.54%
jan 1, 1987
62.008 bln
-2.276 bln
-3.54%
jan 1, 1988
64.385 bln
+2.377 bln
3.83%
jan 1, 1989
70.465 bln
+6.08 bln
9.44%
jan 1, 1990
77.623 bln
+7.158 bln
10.16%
jan 1, 1991
83.817 bln
+6.195 bln
7.98%
jan 1, 1992
88.104 bln
+4.287 bln
5.11%
jan 1, 1993
89.968 bln
+1.864 bln
2.12%
jan 1, 1994
85.03 bln
-4.939 bln
-5.49%
jan 1, 1995
93.814 bln
+8.785 bln
10.33%
jan 1, 1996
99.354 bln
+5.54 bln
5.9%
jan 1, 1997
103.487 bln
+4.133 bln
4.16%
jan 1, 1998
111.003 bln
+7.517 bln
7.26%
jan 1, 1999
117.387 bln
+6.384 bln
5.75%
jan 1, 2000
122.144 bln
+4.757 bln
4.05%
jan 1, 2001
134.593 bln
+12.449 bln
10.19%
jan 1, 2002
141.566 bln
+6.973 bln
5.18%
jan 1, 2003
141.979 bln
+412.795 mln
0.29%
jan 1, 2004
146.96 bln
+4.981 bln
3.51%
jan 1, 2005
158.709 bln
+11.749 bln
7.99%
jan 1, 2006
167.355 bln
+8.645 bln
5.45%
jan 1, 2007
177.167 bln
+9.812 bln
5.86%
jan 1, 2008
187.119 bln
+9.952 bln
5.62%
jan 1, 2009
188.839 bln
+1.72 bln
0.92%
jan 1, 2010
166.143 bln
-22.696 bln
-12.02%
jan 1, 2011
186.062 bln
+19.919 bln
11.99%
jan 1, 2012
197.604 bln
+11.542 bln
6.2%
jan 1, 2013
199.765 bln
+2.161 bln
1.09%
jan 1, 2014
201.066 bln
+1.301 bln
0.65%
jan 1, 2015
203.701 bln
+2.635 bln
1.31%
jan 1, 2016
210.59 bln
+6.889 bln
3.38%
Ranking of countries by current statistics by years


Comments: