29
/
en
AIzaSyAYiBZKx7MnpbEhh9jyipgxe19OcubqV5w
April 1, 2024
93694
Bulgaria
BGR
true
2
1
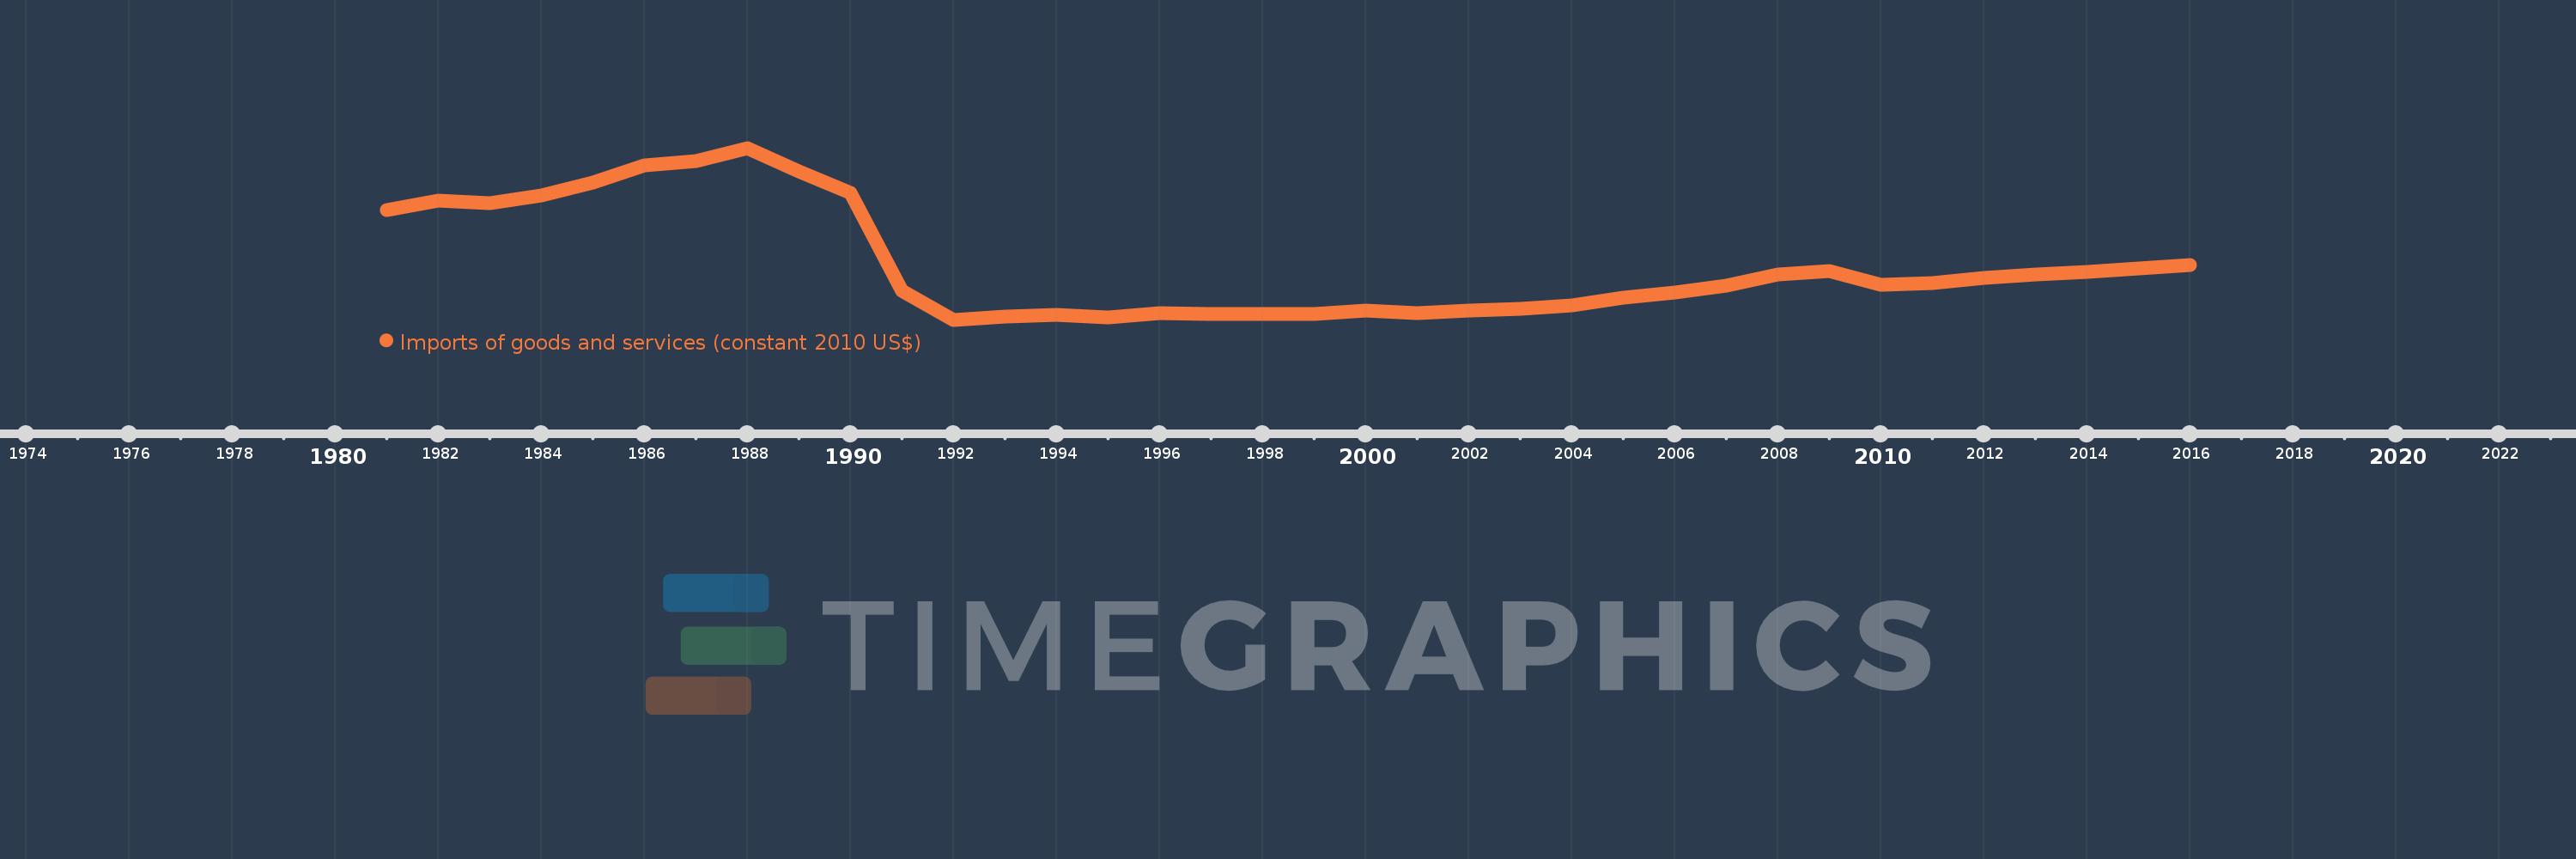
Imports of goods and services (constant 2010 US$)
2016,2015,2014,2013,2012,2011,2010,2009,2008,2007,2006,2005,2004,2003,2002,2001,2000,1999,1998,1997,1996,1995,1994,1993,1992,1991,1990,1989,1988,1987,1986,1985,1984,1983,1982,1981
This statistics in other country:
AfghanistanAlbaniaAlgeriaAngolaAntigua and BarbudaArab WorldArgentinaArmeniaArubaAustraliaAustriaAzerbaijanBahamas, TheBahrainBangladeshBarbadosBelarusBelgiumBelizeBeninBermudaBhutanBoliviaBosnia and HerzegovinaBotswanaBrazilBrunei DarussalamBulgariaBurkina FasoBurundiCabo VerdeCambodiaCameroonCanadaCaribbean small statesCentral African RepublicCentral Europe and the BalticsChadChileChinaColombiaComorosCongo, Dem. Rep.Congo, Rep.Costa RicaCote d'IvoireCroatiaCubaCyprusCzech RepublicDenmarkDominicaDominican RepublicEarly-demographic dividendEast Asia & PacificEast Asia & Pacific (excluding high income)East Asia & Pacific (IDA & IBRD countries)EcuadorEgypt, Arab Rep.El SalvadorEquatorial GuineaEritreaEstoniaEuro areaEurope & Central AsiaEurope & Central Asia (excluding high income)Europe & Central Asia (IDA & IBRD countries)European UnionFaroe IslandsFijiFinlandFragile and conflict affected situationsFranceGabonGambia, TheGeorgiaGermanyGhanaGreeceGrenadaGuatemalaGuineaGuinea-BissauGuyanaHaitiHeavily indebted poor countries (HIPC)High incomeHondurasHong Kong SAR, ChinaHungaryIBRD onlyIcelandIDA & IBRD totalIDA blendIDA onlyIDA totalIndiaIndonesiaIran, Islamic Rep.IraqIrelandIsraelItalyJamaicaJapanJordanKazakhstanKenyaKiribatiKorea, Rep.KosovoKuwaitKyrgyz RepublicLao PDRLate-demographic dividendLatin America & Caribbean Latin America & Caribbean (excluding high income)Latin America & the Caribbean (IDA & IBRD countries)LatviaLeast developed countries: UN classificationLebanonLiberiaLibyaLithuaniaLow & middle incomeLow incomeLower middle incomeLuxembourgMacao SAR, ChinaMacedonia, FYRMadagascarMalawiMalaysiaMaldivesMaliMaltaMauritaniaMauritiusMexicoMiddle East & North AfricaMiddle East & North Africa (excluding high income)Middle East & North Africa (IDA & IBRD countries)Middle incomeMoldovaMongoliaMontenegroMoroccoMozambiqueMyanmarNamibiaNepalNetherlandsNew ZealandNicaraguaNigerNigeriaNorth AmericaNorwayOECD membersOmanOther small statesPacific island small statesPakistanPalauPanamaParaguayPeruPhilippinesPolandPortugalPost-demographic dividendPre-demographic dividendPuerto RicoQatarRomaniaRussian FederationRwandaSamoaSaudi ArabiaSenegalSerbiaSeychellesSierra LeoneSingaporeSlovak RepublicSloveniaSmall statesSolomon IslandsSouth AfricaSouth AsiaSouth Asia (IDA & IBRD)South SudanSpainSri LankaSt. Kitts and NevisSt. LuciaSt. Vincent and the GrenadinesSub-Saharan Africa Sub-Saharan Africa (excluding high income)Sub-Saharan Africa (IDA & IBRD countries)SudanSurinameSwazilandSwedenSwitzerlandTajikistanTanzaniaThailandTimor-LesteTogoTongaTrinidad and TobagoTunisiaTurkeyTurkmenistanUgandaUkraineUnited Arab EmiratesUnited KingdomUnited StatesUpper middle incomeUruguayUzbekistanVanuatuVenezuela, RBVietnamWest Bank and GazaWorldYemen, Rep.ZambiaZimbabwe Timeline:
This timeline shows a graph from 1981 to 2016 of Bulgaria. No data until 1980. Number of actual observations by date: 36.
Source name:
World Development Indicators
Source organization:
World Bank national accounts data, and OECD National Accounts data files.
Categories, topics:
Economy & Growth, Trade
Last updated:
apr 23, 2017
Indicators value changes by year
Minimum:
7.641 bln
jan 1, 1992
Maximum:
97.232 bln
jan 1, 1988
At the date of observation
Value
Absolute change
Change from previous value
jan 1, 1981
64.802 bln
+64.802 bln
0.0%
jan 1, 1982
69.672 bln
+4.87 bln
7.52%
jan 1, 1983
68.644 bln
-1.028 bln
-1.48%
jan 1, 1984
72.335 bln
+3.691 bln
5.38%
jan 1, 1985
79.246 bln
+6.911 bln
9.55%
jan 1, 1986
87.958 bln
+8.712 bln
10.99%
jan 1, 1987
90.307 bln
+2.35 bln
2.67%
jan 1, 1988
97.232 bln
+6.924 bln
7.67%
jan 1, 1989
85.084 bln
-12.148 bln
-12.49%
jan 1, 1990
74.019 bln
-11.065 bln
-13.0%
jan 1, 1991
22.573 bln
-51.446 bln
-69.5%
jan 1, 1992
7.641 bln
-14.932 bln
-66.15%
jan 1, 1993
9.207 bln
+1.565 bln
20.49%
jan 1, 1994
10.063 bln
+856.153 mln
9.3%
jan 1, 1995
8.742 bln
-1.321 bln
-13.12%
jan 1, 1996
10.963 bln
+2.221 bln
25.41%
jan 1, 1997
10.821 bln
-142.525 mln
-1.3%
jan 1, 1998
10.771 bln
-49.898 mln
-0.46%
jan 1, 1999
10.53 bln
-241.17 mln
-2.24%
jan 1, 2000
12.266 bln
+1.736 bln
16.49%
jan 1, 2001
11.082 bln
-1.184 bln
-9.66%
jan 1, 2002
12.474 bln
+1.392 bln
12.56%
jan 1, 2003
13.259 bln
+784.728 mln
6.29%
jan 1, 2004
15.267 bln
+2.009 bln
15.15%
jan 1, 2005
19.274 bln
+4.007 bln
26.24%
jan 1, 2006
22.039 bln
+2.765 bln
14.35%
jan 1, 2007
25.547 bln
+3.508 bln
15.92%
jan 1, 2008
31.325 bln
+5.778 bln
22.62%
jan 1, 2009
32.849 bln
+1.524 bln
4.86%
jan 1, 2010
25.783 bln
-7.065 bln
-21.51%
jan 1, 2011
26.838 bln
+1.054 bln
4.09%
jan 1, 2012
29.504 bln
+2.666 bln
9.94%
jan 1, 2013
31.141 bln
+1.637 bln
5.55%
jan 1, 2014
32.486 bln
+1.344 bln
4.32%
jan 1, 2015
34.162 bln
+1.676 bln
5.16%
jan 1, 2016
36.022 bln
+1.859 bln
5.44%
Ranking of countries by current statistics by years


Comments: