29
/
en
AIzaSyAYiBZKx7MnpbEhh9jyipgxe19OcubqV5w
April 1, 2024
139387
Germany
DEU
true
2
1
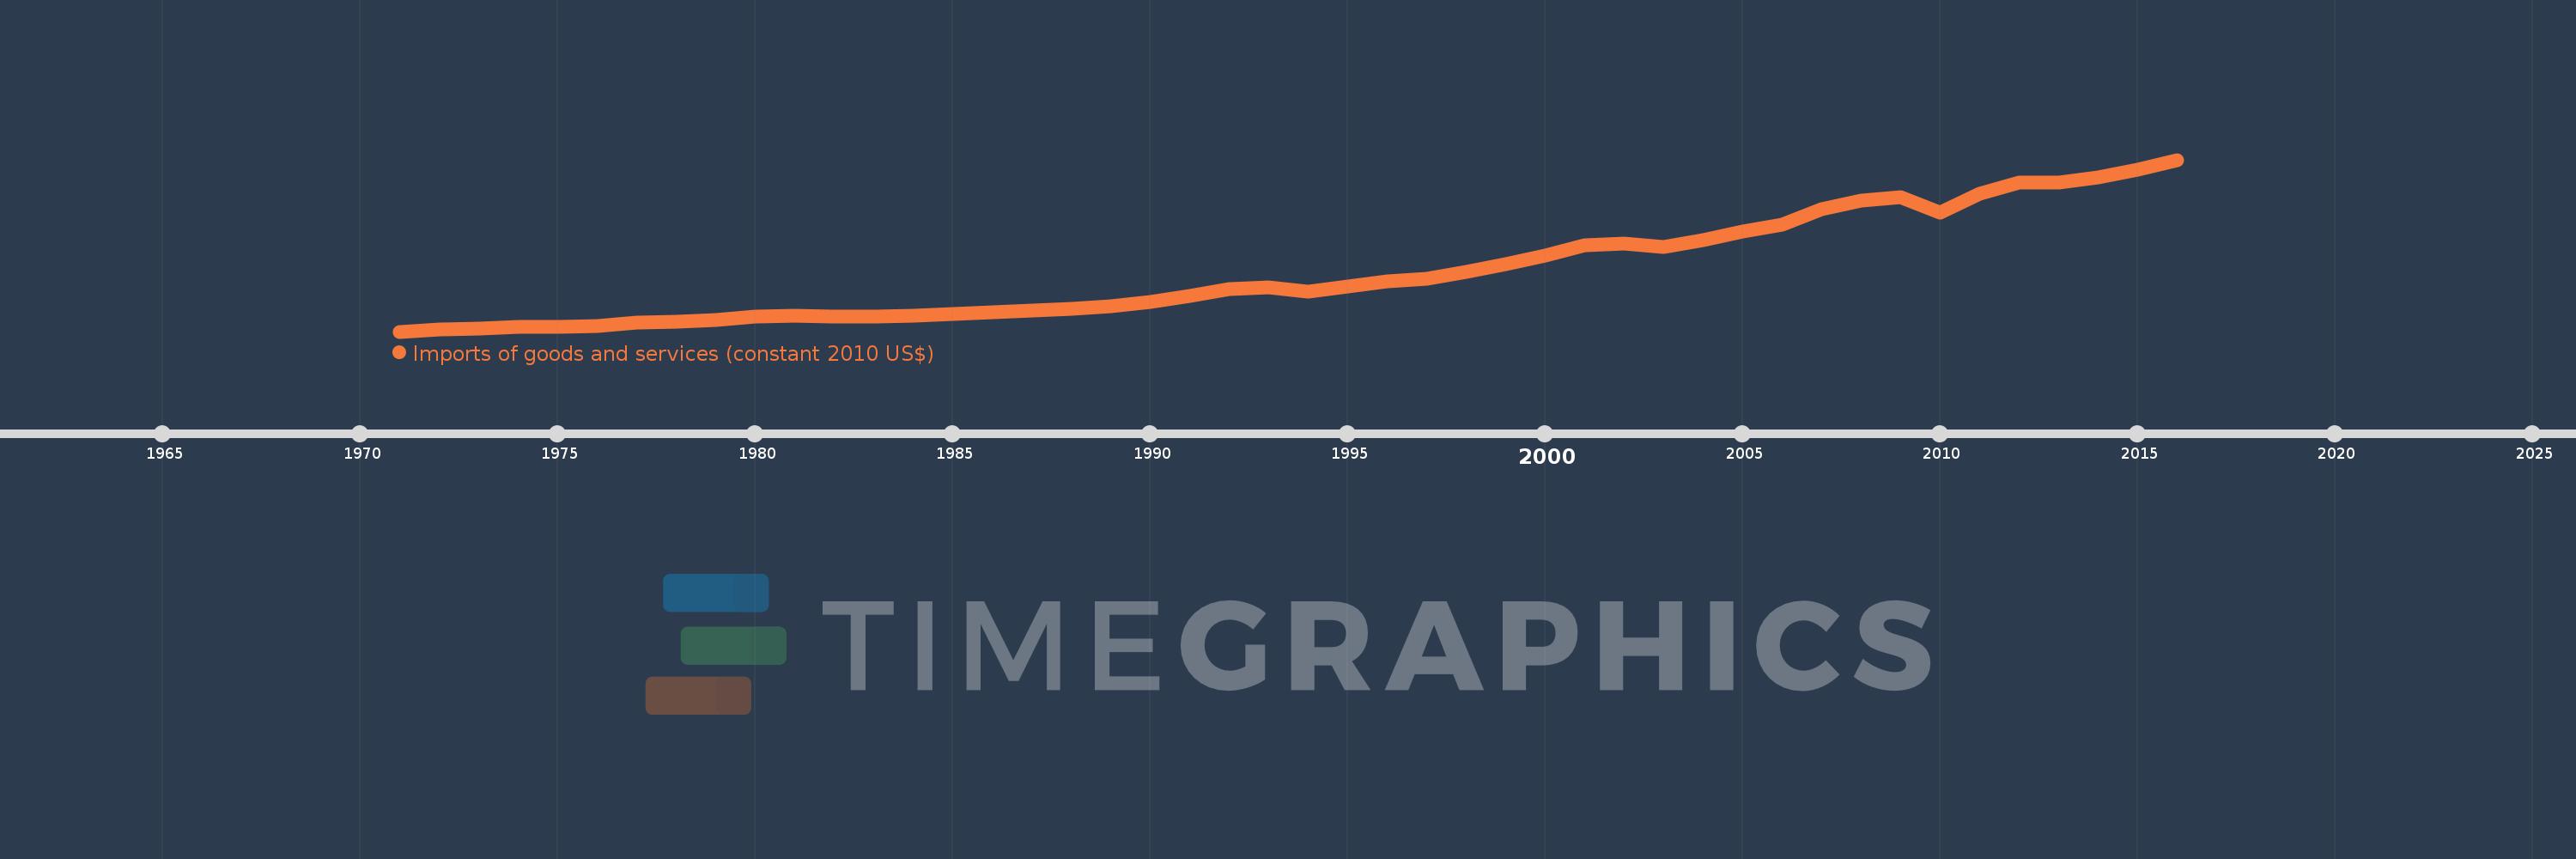
Imports of goods and services (constant 2010 US$)
2016,2015,2014,2013,2012,2011,2010,2009,2008,2007,2006,2005,2004,2003,2002,2001,2000,1999,1998,1997,1996,1995,1994,1993,1992,1991,1990,1989,1988,1987,1986,1985,1984,1983,1982,1981,1980,1979,1978,1977,1976,1975,1974,1973,1972,1971
This statistics in other country:
AfghanistanAlbaniaAlgeriaAngolaAntigua and BarbudaArab WorldArgentinaArmeniaArubaAustraliaAustriaAzerbaijanBahamas, TheBahrainBangladeshBarbadosBelarusBelgiumBelizeBeninBermudaBhutanBoliviaBosnia and HerzegovinaBotswanaBrazilBrunei DarussalamBulgariaBurkina FasoBurundiCabo VerdeCambodiaCameroonCanadaCaribbean small statesCentral African RepublicCentral Europe and the BalticsChadChileChinaColombiaComorosCongo, Dem. Rep.Congo, Rep.Costa RicaCote d'IvoireCroatiaCubaCyprusCzech RepublicDenmarkDominicaDominican RepublicEarly-demographic dividendEast Asia & PacificEast Asia & Pacific (excluding high income)East Asia & Pacific (IDA & IBRD countries)EcuadorEgypt, Arab Rep.El SalvadorEquatorial GuineaEritreaEstoniaEuro areaEurope & Central AsiaEurope & Central Asia (excluding high income)Europe & Central Asia (IDA & IBRD countries)European UnionFaroe IslandsFijiFinlandFragile and conflict affected situationsFranceGabonGambia, TheGeorgiaGermanyGhanaGreeceGrenadaGuatemalaGuineaGuinea-BissauGuyanaHaitiHeavily indebted poor countries (HIPC)High incomeHondurasHong Kong SAR, ChinaHungaryIBRD onlyIcelandIDA & IBRD totalIDA blendIDA onlyIDA totalIndiaIndonesiaIran, Islamic Rep.IraqIrelandIsraelItalyJamaicaJapanJordanKazakhstanKenyaKiribatiKorea, Rep.KosovoKuwaitKyrgyz RepublicLao PDRLate-demographic dividendLatin America & Caribbean Latin America & Caribbean (excluding high income)Latin America & the Caribbean (IDA & IBRD countries)LatviaLeast developed countries: UN classificationLebanonLiberiaLibyaLithuaniaLow & middle incomeLow incomeLower middle incomeLuxembourgMacao SAR, ChinaMacedonia, FYRMadagascarMalawiMalaysiaMaldivesMaliMaltaMauritaniaMauritiusMexicoMiddle East & North AfricaMiddle East & North Africa (excluding high income)Middle East & North Africa (IDA & IBRD countries)Middle incomeMoldovaMongoliaMontenegroMoroccoMozambiqueMyanmarNamibiaNepalNetherlandsNew ZealandNicaraguaNigerNigeriaNorth AmericaNorwayOECD membersOmanOther small statesPacific island small statesPakistanPalauPanamaParaguayPeruPhilippinesPolandPortugalPost-demographic dividendPre-demographic dividendPuerto RicoQatarRomaniaRussian FederationRwandaSamoaSaudi ArabiaSenegalSerbiaSeychellesSierra LeoneSingaporeSlovak RepublicSloveniaSmall statesSolomon IslandsSouth AfricaSouth AsiaSouth Asia (IDA & IBRD)South SudanSpainSri LankaSt. Kitts and NevisSt. LuciaSt. Vincent and the GrenadinesSub-Saharan Africa Sub-Saharan Africa (excluding high income)Sub-Saharan Africa (IDA & IBRD countries)SudanSurinameSwazilandSwedenSwitzerlandTajikistanTanzaniaThailandTimor-LesteTogoTongaTrinidad and TobagoTunisiaTurkeyTurkmenistanUgandaUkraineUnited Arab EmiratesUnited KingdomUnited StatesUpper middle incomeUruguayUzbekistanVanuatuVenezuela, RBVietnamWest Bank and GazaWorldYemen, Rep.ZambiaZimbabwe Timeline:
This timeline shows a graph from 1971 to 2016 of Germany. No data until 1970. Number of actual observations by date: 46.
Source name:
World Development Indicators
Source organization:
World Bank national accounts data, and OECD National Accounts data files.
Categories, topics:
Economy & Growth, Trade
Last updated:
apr 23, 2017
Indicators value changes by year
Minimum:
187.718 bln
jan 1, 1971
Maximum:
1.533 trl
jan 1, 2016
At the date of observation
Value
Absolute change
Change from previous value
jan 1, 1971
187.718 bln
+187.718 bln
0.0%
jan 1, 1972
201.552 bln
+13.834 bln
7.37%
jan 1, 1973
214.609 bln
+13.057 bln
6.48%
jan 1, 1974
222.433 bln
+7.824 bln
3.65%
jan 1, 1975
223.417 bln
+984.451 mln
0.44%
jan 1, 1976
229.946 bln
+6.528 bln
2.92%
jan 1, 1977
254.972 bln
+25.026 bln
10.88%
jan 1, 1978
264.298 bln
+9.326 bln
3.66%
jan 1, 1979
278.702 bln
+14.404 bln
5.45%
jan 1, 1980
305.541 bln
+26.839 bln
9.63%
jan 1, 1981
314.971 bln
+9.43 bln
3.09%
jan 1, 1982
305.645 bln
-9.326 bln
-2.96%
jan 1, 1983
303.261 bln
-2.383 bln
-0.78%
jan 1, 1984
311.448 bln
+8.186 bln
2.7%
jan 1, 1985
327.872 bln
+16.425 bln
5.27%
jan 1, 1986
341.085 bln
+13.212 bln
4.03%
jan 1, 1987
352.121 bln
+11.036 bln
3.24%
jan 1, 1988
368.235 bln
+16.114 bln
4.58%
jan 1, 1989
388.39 bln
+20.155 bln
5.47%
jan 1, 1990
421.757 bln
+33.368 bln
8.59%
jan 1, 1991
467.197 bln
+45.44 bln
10.77%
jan 1, 1992
518.13 bln
+50.932 bln
10.9%
jan 1, 1993
534.464 bln
+16.334 bln
3.15%
jan 1, 1994
499.39 bln
-35.074 bln
-6.56%
jan 1, 1995
540.415 bln
+41.025 bln
8.22%
jan 1, 1996
578.654 bln
+38.239 bln
7.08%
jan 1, 1997
601.952 bln
+23.298 bln
4.03%
jan 1, 1998
656.652 bln
+54.7 bln
9.09%
jan 1, 1999
718.189 bln
+61.537 bln
9.37%
jan 1, 2000
781.626 bln
+63.437 bln
8.83%
jan 1, 2001
866.715 bln
+85.089 bln
10.89%
jan 1, 2002
874.059 bln
+7.344 bln
0.85%
jan 1, 2003
851.9 bln
-22.159 bln
-2.54%
jan 1, 2004
900.649 bln
+48.749 bln
5.72%
jan 1, 2005
972.063 bln
+71.414 bln
7.93%
jan 1, 2006
1.028 trl
+56.093 bln
5.77%
jan 1, 2007
1.143 trl
+114.465 bln
11.13%
jan 1, 2008
1.214 trl
+71.287 bln
6.24%
jan 1, 2009
1.241 trl
+27.223 bln
2.24%
jan 1, 2010
1.122 trl
-119.15 bln
-9.6%
jan 1, 2011
1.266 trl
+144.22 bln
12.85%
jan 1, 2012
1.355 trl
+88.887 bln
7.02%
jan 1, 2013
1.354 trl
-886.344 mln
-0.07%
jan 1, 2014
1.397 trl
+42.418 bln
3.13%
jan 1, 2015
1.453 trl
+56.473 bln
4.04%
jan 1, 2016
1.533 trl
+79.517 bln
5.47%
Ranking of countries by current statistics by years


Comments: