29
/
en
AIzaSyAYiBZKx7MnpbEhh9jyipgxe19OcubqV5w
April 1, 2024
228610
Romania
ROU
true
2
1
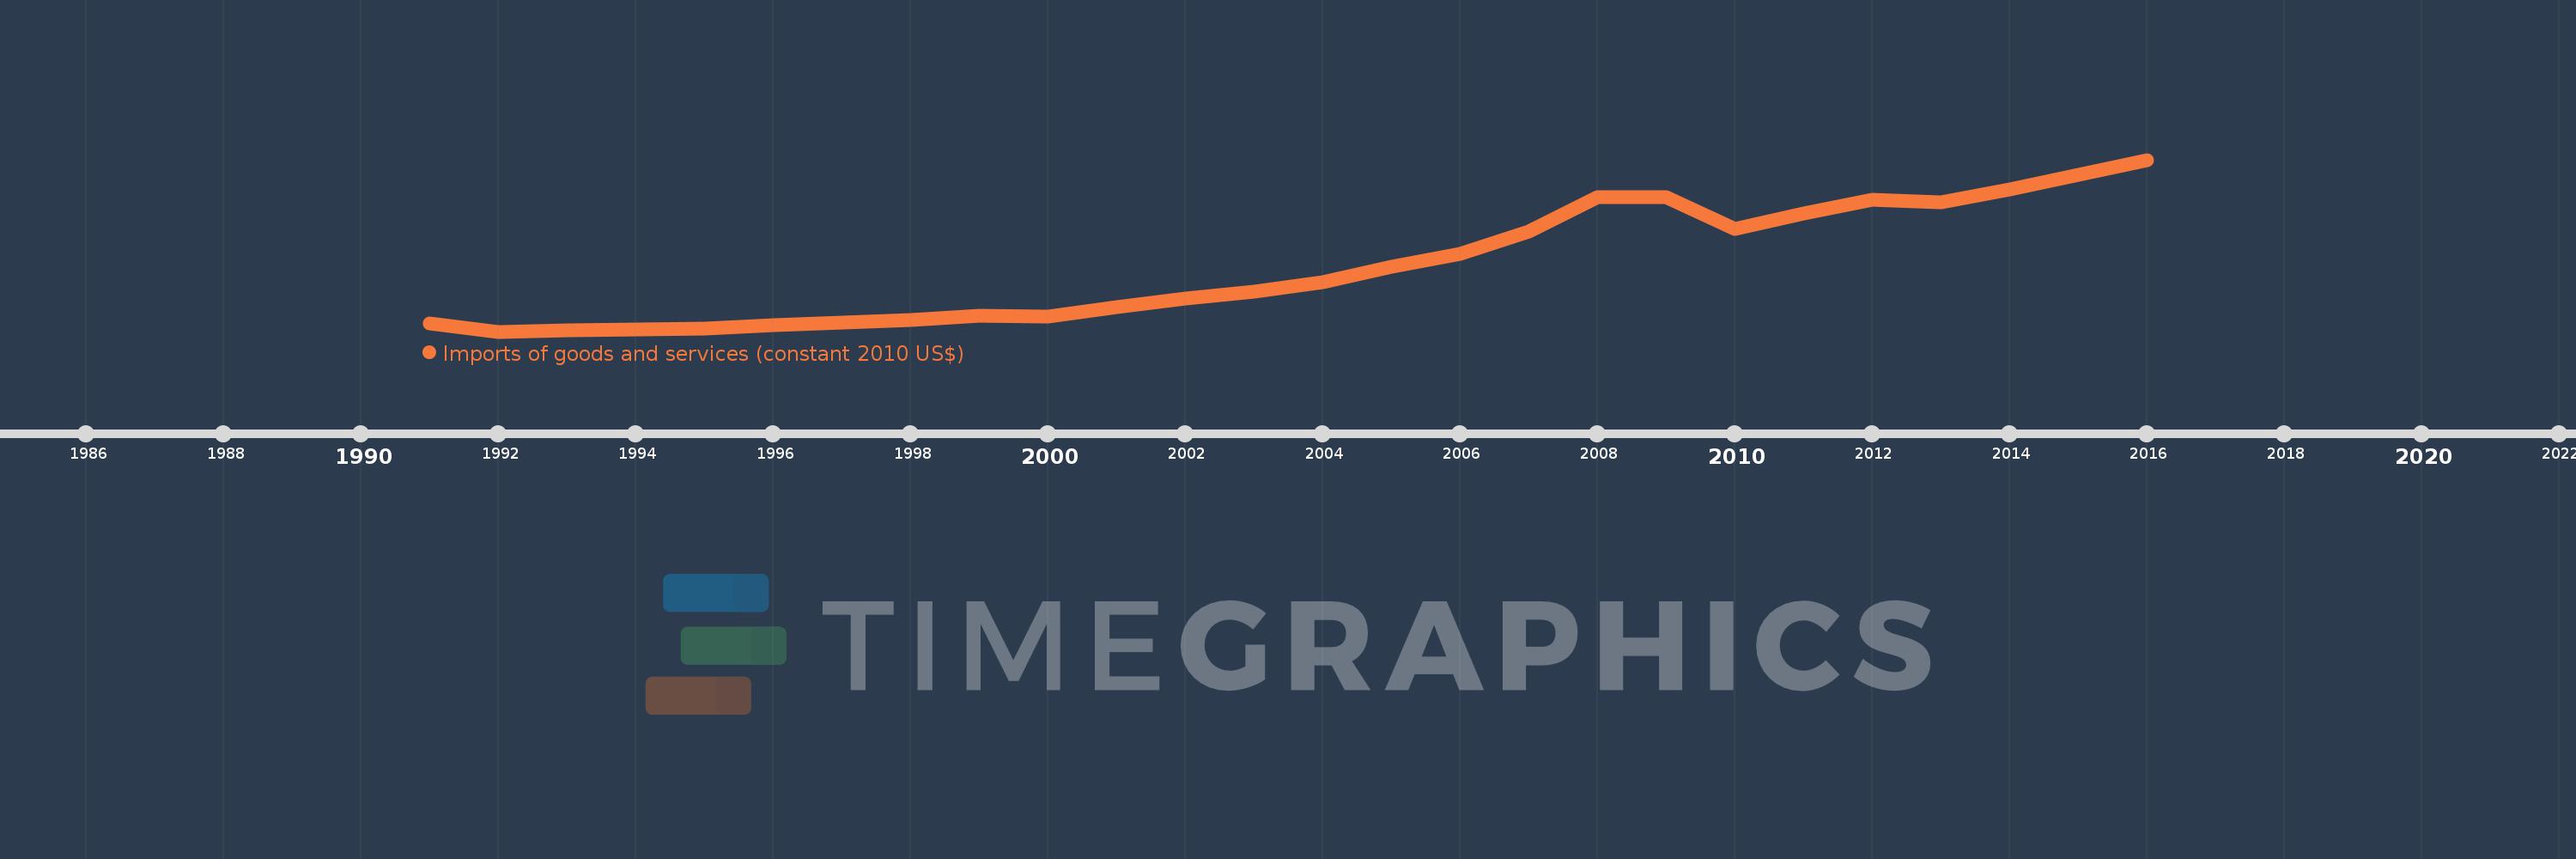
Imports of goods and services (constant 2010 US$)
2016,2015,2014,2013,2012,2011,2010,2009,2008,2007,2006,2005,2004,2003,2002,2001,2000,1999,1998,1997,1996,1995,1994,1993,1992,1991
This statistics in other country:
AfghanistanAlbaniaAlgeriaAngolaAntigua and BarbudaArab WorldArgentinaArmeniaArubaAustraliaAustriaAzerbaijanBahamas, TheBahrainBangladeshBarbadosBelarusBelgiumBelizeBeninBermudaBhutanBoliviaBosnia and HerzegovinaBotswanaBrazilBrunei DarussalamBulgariaBurkina FasoBurundiCabo VerdeCambodiaCameroonCanadaCaribbean small statesCentral African RepublicCentral Europe and the BalticsChadChileChinaColombiaComorosCongo, Dem. Rep.Congo, Rep.Costa RicaCote d'IvoireCroatiaCubaCyprusCzech RepublicDenmarkDominicaDominican RepublicEarly-demographic dividendEast Asia & PacificEast Asia & Pacific (excluding high income)East Asia & Pacific (IDA & IBRD countries)EcuadorEgypt, Arab Rep.El SalvadorEquatorial GuineaEritreaEstoniaEuro areaEurope & Central AsiaEurope & Central Asia (excluding high income)Europe & Central Asia (IDA & IBRD countries)European UnionFaroe IslandsFijiFinlandFragile and conflict affected situationsFranceGabonGambia, TheGeorgiaGermanyGhanaGreeceGrenadaGuatemalaGuineaGuinea-BissauGuyanaHaitiHeavily indebted poor countries (HIPC)High incomeHondurasHong Kong SAR, ChinaHungaryIBRD onlyIcelandIDA & IBRD totalIDA blendIDA onlyIDA totalIndiaIndonesiaIran, Islamic Rep.IraqIrelandIsraelItalyJamaicaJapanJordanKazakhstanKenyaKiribatiKorea, Rep.KosovoKuwaitKyrgyz RepublicLao PDRLate-demographic dividendLatin America & Caribbean Latin America & Caribbean (excluding high income)Latin America & the Caribbean (IDA & IBRD countries)LatviaLeast developed countries: UN classificationLebanonLiberiaLibyaLithuaniaLow & middle incomeLow incomeLower middle incomeLuxembourgMacao SAR, ChinaMacedonia, FYRMadagascarMalawiMalaysiaMaldivesMaliMaltaMauritaniaMauritiusMexicoMiddle East & North AfricaMiddle East & North Africa (excluding high income)Middle East & North Africa (IDA & IBRD countries)Middle incomeMoldovaMongoliaMontenegroMoroccoMozambiqueMyanmarNamibiaNepalNetherlandsNew ZealandNicaraguaNigerNigeriaNorth AmericaNorwayOECD membersOmanOther small statesPacific island small statesPakistanPalauPanamaParaguayPeruPhilippinesPolandPortugalPost-demographic dividendPre-demographic dividendPuerto RicoQatarRomaniaRussian FederationRwandaSamoaSaudi ArabiaSenegalSerbiaSeychellesSierra LeoneSingaporeSlovak RepublicSloveniaSmall statesSolomon IslandsSouth AfricaSouth AsiaSouth Asia (IDA & IBRD)South SudanSpainSri LankaSt. Kitts and NevisSt. LuciaSt. Vincent and the GrenadinesSub-Saharan Africa Sub-Saharan Africa (excluding high income)Sub-Saharan Africa (IDA & IBRD countries)SudanSurinameSwazilandSwedenSwitzerlandTajikistanTanzaniaThailandTimor-LesteTogoTongaTrinidad and TobagoTunisiaTurkeyTurkmenistanUgandaUkraineUnited Arab EmiratesUnited KingdomUnited StatesUpper middle incomeUruguayUzbekistanVanuatuVenezuela, RBVietnamWest Bank and GazaWorldYemen, Rep.ZambiaZimbabwe Timeline:
This timeline shows a graph from 1991 to 2016 of Romania. No data until 1990. Number of actual observations by date: 26.
Source name:
World Development Indicators
Source organization:
World Bank national accounts data, and OECD National Accounts data files.
Categories, topics:
Economy & Growth, Trade
Last updated:
apr 23, 2017
Indicators value changes by year
Minimum:
9.122 bln
jan 1, 1992
Maximum:
89.898 bln
jan 1, 2016
At the date of observation
Value
Absolute change
Change from previous value
jan 1, 1991
12.96 bln
+12.96 bln
0.0%
jan 1, 1992
9.122 bln
-3.838 bln
-29.61%
jan 1, 1993
9.808 bln
+685.976 mln
7.52%
jan 1, 1994
10.239 bln
+430.363 mln
4.39%
jan 1, 1995
10.526 bln
+287.705 mln
2.81%
jan 1, 1996
12.247 bln
+1.72 bln
16.34%
jan 1, 1997
13.353 bln
+1.106 bln
9.03%
jan 1, 1998
14.753 bln
+1.4 bln
10.49%
jan 1, 1999
16.457 bln
+1.704 bln
11.55%
jan 1, 2000
16.317 bln
-139.216 mln
-0.85%
jan 1, 2001
20.809 bln
+4.491 bln
27.53%
jan 1, 2002
24.692 bln
+3.883 bln
18.66%
jan 1, 2003
27.728 bln
+3.035 bln
12.29%
jan 1, 2004
32.304 bln
+4.577 bln
16.51%
jan 1, 2005
39.429 bln
+7.125 bln
22.05%
jan 1, 2006
45.746 bln
+6.317 bln
16.02%
jan 1, 2007
56.104 bln
+10.358 bln
22.64%
jan 1, 2008
72.248 bln
+16.144 bln
28.78%
jan 1, 2009
72.374 bln
+126.367 mln
0.17%
jan 1, 2010
57.373 bln
-15.001 bln
-20.73%
jan 1, 2011
64.583 bln
+7.21 bln
12.57%
jan 1, 2012
71.155 bln
+6.572 bln
10.18%
jan 1, 2013
69.878 bln
-1.277 bln
-1.79%
jan 1, 2014
76.022 bln
+6.144 bln
8.79%
jan 1, 2015
82.645 bln
+6.623 bln
8.71%
jan 1, 2016
89.898 bln
+7.254 bln
8.78%
Ranking of countries by current statistics by years


Comments: