29
/
en
AIzaSyAYiBZKx7MnpbEhh9jyipgxe19OcubqV5w
April 1, 2024
78374
Bangladesh
BGD
true
2
1
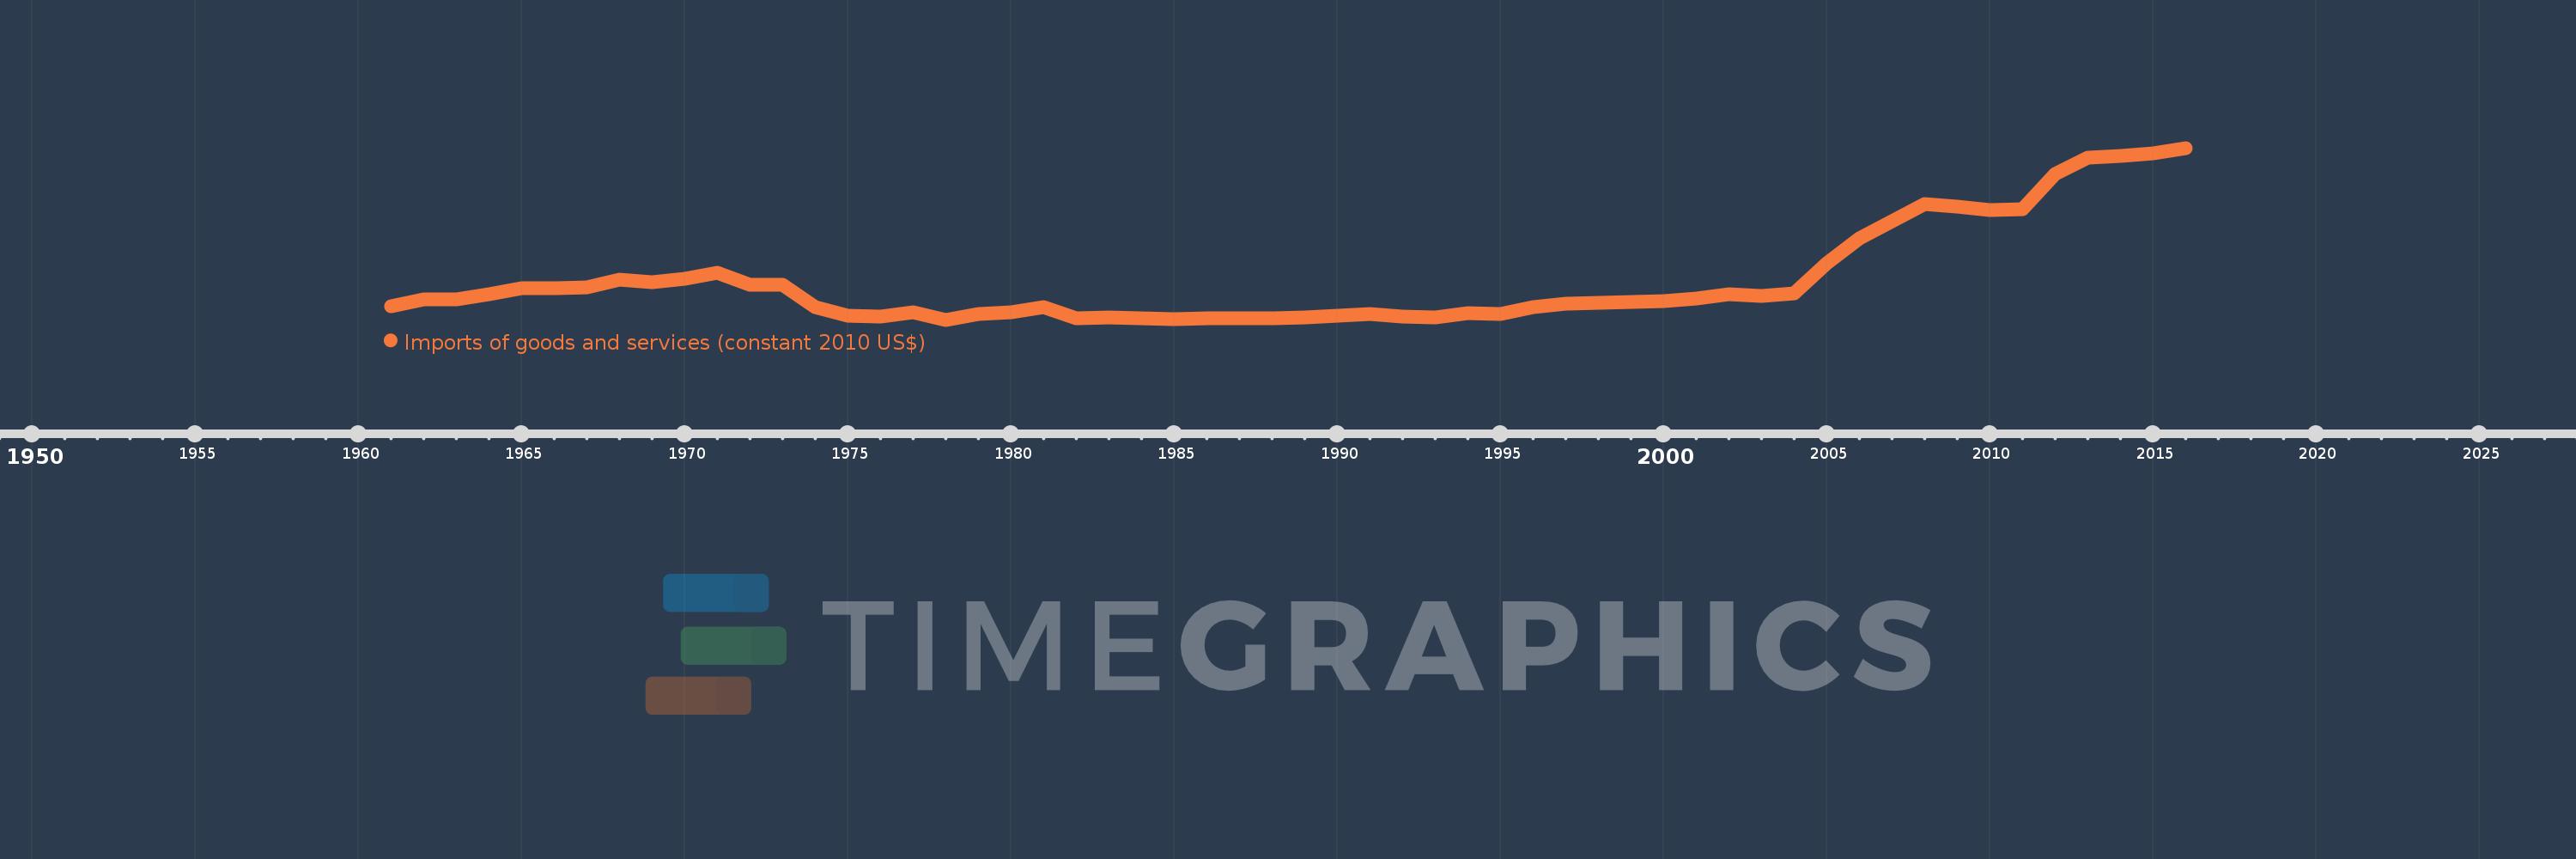
Imports of goods and services (constant 2010 US$)
2016,2015,2014,2013,2012,2011,2010,2009,2008,2007,2006,2005,2004,2003,2002,2001,2000,1999,1998,1997,1996,1995,1994,1993,1992,1991,1990,1989,1988,1987,1986,1985,1984,1983,1982,1981,1980,1979,1978,1977,1976,1975,1974,1973,1972,1971,1970,1969,1968,1967,1966,1965,1964,1963,1962,1961
This statistics in other country:
AfghanistanAlbaniaAlgeriaAngolaAntigua and BarbudaArab WorldArgentinaArmeniaArubaAustraliaAustriaAzerbaijanBahamas, TheBahrainBangladeshBarbadosBelarusBelgiumBelizeBeninBermudaBhutanBoliviaBosnia and HerzegovinaBotswanaBrazilBrunei DarussalamBulgariaBurkina FasoBurundiCabo VerdeCambodiaCameroonCanadaCaribbean small statesCentral African RepublicCentral Europe and the BalticsChadChileChinaColombiaComorosCongo, Dem. Rep.Congo, Rep.Costa RicaCote d'IvoireCroatiaCubaCyprusCzech RepublicDenmarkDominicaDominican RepublicEarly-demographic dividendEast Asia & PacificEast Asia & Pacific (excluding high income)East Asia & Pacific (IDA & IBRD countries)EcuadorEgypt, Arab Rep.El SalvadorEquatorial GuineaEritreaEstoniaEuro areaEurope & Central AsiaEurope & Central Asia (excluding high income)Europe & Central Asia (IDA & IBRD countries)European UnionFaroe IslandsFijiFinlandFragile and conflict affected situationsFranceGabonGambia, TheGeorgiaGermanyGhanaGreeceGrenadaGuatemalaGuineaGuinea-BissauGuyanaHaitiHeavily indebted poor countries (HIPC)High incomeHondurasHong Kong SAR, ChinaHungaryIBRD onlyIcelandIDA & IBRD totalIDA blendIDA onlyIDA totalIndiaIndonesiaIran, Islamic Rep.IraqIrelandIsraelItalyJamaicaJapanJordanKazakhstanKenyaKiribatiKorea, Rep.KosovoKuwaitKyrgyz RepublicLao PDRLate-demographic dividendLatin America & Caribbean Latin America & Caribbean (excluding high income)Latin America & the Caribbean (IDA & IBRD countries)LatviaLeast developed countries: UN classificationLebanonLiberiaLibyaLithuaniaLow & middle incomeLow incomeLower middle incomeLuxembourgMacao SAR, ChinaMacedonia, FYRMadagascarMalawiMalaysiaMaldivesMaliMaltaMauritaniaMauritiusMexicoMiddle East & North AfricaMiddle East & North Africa (excluding high income)Middle East & North Africa (IDA & IBRD countries)Middle incomeMoldovaMongoliaMontenegroMoroccoMozambiqueMyanmarNamibiaNepalNetherlandsNew ZealandNicaraguaNigerNigeriaNorth AmericaNorwayOECD membersOmanOther small statesPacific island small statesPakistanPalauPanamaParaguayPeruPhilippinesPolandPortugalPost-demographic dividendPre-demographic dividendPuerto RicoQatarRomaniaRussian FederationRwandaSamoaSaudi ArabiaSenegalSerbiaSeychellesSierra LeoneSingaporeSlovak RepublicSloveniaSmall statesSolomon IslandsSouth AfricaSouth AsiaSouth Asia (IDA & IBRD)South SudanSpainSri LankaSt. Kitts and NevisSt. LuciaSt. Vincent and the GrenadinesSub-Saharan Africa Sub-Saharan Africa (excluding high income)Sub-Saharan Africa (IDA & IBRD countries)SudanSurinameSwazilandSwedenSwitzerlandTajikistanTanzaniaThailandTimor-LesteTogoTongaTrinidad and TobagoTunisiaTurkeyTurkmenistanUgandaUkraineUnited Arab EmiratesUnited KingdomUnited StatesUpper middle incomeUruguayUzbekistanVanuatuVenezuela, RBVietnamWest Bank and GazaWorldYemen, Rep.ZambiaZimbabwe Timeline:
This timeline shows a graph from 1961 to 2016 of Bangladesh. No data until 1960. Number of actual observations by date: 56.
Source name:
World Development Indicators
Source organization:
World Bank national accounts data, and OECD National Accounts data files.
Categories, topics:
Economy & Growth, Trade
Last updated:
apr 23, 2017
Indicators value changes by year
Minimum:
1.938 bln
jan 1, 1978
Maximum:
37.872 bln
jan 1, 2016
At the date of observation
Value
Absolute change
Change from previous value
jan 1, 1961
4.746 bln
+4.746 bln
0.0%
jan 1, 1962
6.28 bln
+1.534 bln
32.31%
jan 1, 1963
6.232 bln
-48.378 mln
-0.77%
jan 1, 1964
7.288 bln
+1.056 bln
16.95%
jan 1, 1965
8.477 bln
+1.189 bln
16.32%
jan 1, 1966
8.443 bln
-34.215 mln
-0.4%
jan 1, 1967
8.785 bln
+342.713 mln
4.06%
jan 1, 1968
10.265 bln
+1.479 bln
16.84%
jan 1, 1969
9.7 bln
-564.328 mln
-5.5%
jan 1, 1970
10.482 bln
+782.015 mln
8.06%
jan 1, 1971
11.726 bln
+1.243 bln
11.86%
jan 1, 1972
9.192 bln
-2.533 bln
-21.6%
jan 1, 1973
9.182 bln
-10.097 mln
-0.11%
jan 1, 1974
4.555 bln
-4.627 bln
-50.4%
jan 1, 1975
2.854 bln
-1.701 bln
-37.34%
jan 1, 1976
2.545 bln
-308.978 mln
-10.83%
jan 1, 1977
3.503 bln
+957.734 mln
37.63%
jan 1, 1978
1.938 bln
-1.565 bln
-44.67%
jan 1, 1979
3.075 bln
+1.137 bln
58.66%
jan 1, 1980
3.412 bln
+337.108 mln
10.96%
jan 1, 1981
4.553 bln
+1.141 bln
33.44%
jan 1, 1982
2.162 bln
-2.391 bln
-52.51%
jan 1, 1983
2.365 bln
+203.334 mln
9.4%
jan 1, 1984
2.267 bln
-98.104 mln
-4.15%
jan 1, 1985
2.121 bln
-146.656 mln
-6.47%
jan 1, 1986
2.274 bln
+153.577 mln
7.24%
jan 1, 1987
2.18 bln
-94.576 mln
-4.16%
jan 1, 1988
2.304 bln
+124.28 mln
5.7%
jan 1, 1989
2.477 bln
+172.628 mln
7.49%
jan 1, 1990
2.849 bln
+372.654 mln
15.05%
jan 1, 1991
3.115 bln
+265.341 mln
9.31%
jan 1, 1992
2.647 bln
-467.729 mln
-15.02%
jan 1, 1993
2.414 bln
-232.675 mln
-8.79%
jan 1, 1994
3.318 bln
+903.356 mln
37.42%
jan 1, 1995
3.115 bln
-202.737 mln
-6.11%
jan 1, 1996
4.622 bln
+1.507 bln
48.4%
jan 1, 1997
5.274 bln
+652.177 mln
14.11%
jan 1, 1998
5.435 bln
+160.406 mln
3.04%
jan 1, 1999
5.678 bln
+242.989 mln
4.47%
jan 1, 2000
5.809 bln
+130.906 mln
2.31%
jan 1, 2001
6.403 bln
+594.459 mln
10.23%
jan 1, 2002
7.226 bln
+822.72 mln
12.85%
jan 1, 2003
6.876 bln
-350.27 mln
-4.85%
jan 1, 2004
7.463 bln
+587.835 mln
8.55%
jan 1, 2005
13.789 bln
+6.325 bln
84.75%
jan 1, 2006
19.037 bln
+5.248 bln
38.06%
jan 1, 2007
22.5 bln
+3.463 bln
18.19%
jan 1, 2008
26.097 bln
+3.597 bln
15.99%
jan 1, 2009
25.601 bln
-496.162 mln
-1.9%
jan 1, 2010
24.935 bln
-665.529 mln
-2.6%
jan 1, 2011
25.106 bln
+171.169 mln
0.69%
jan 1, 2012
32.426 bln
+7.319 bln
29.15%
jan 1, 2013
35.836 bln
+3.411 bln
10.52%
jan 1, 2014
36.273 bln
+436.54 mln
1.22%
jan 1, 2015
36.697 bln
+423.784 mln
1.17%
jan 1, 2016
37.872 bln
+1.175 bln
3.2%
Ranking of countries by current statistics by years


Comments: