29
/
en
AIzaSyAYiBZKx7MnpbEhh9jyipgxe19OcubqV5w
April 1, 2024
35826
High income
HIC
false
2
1
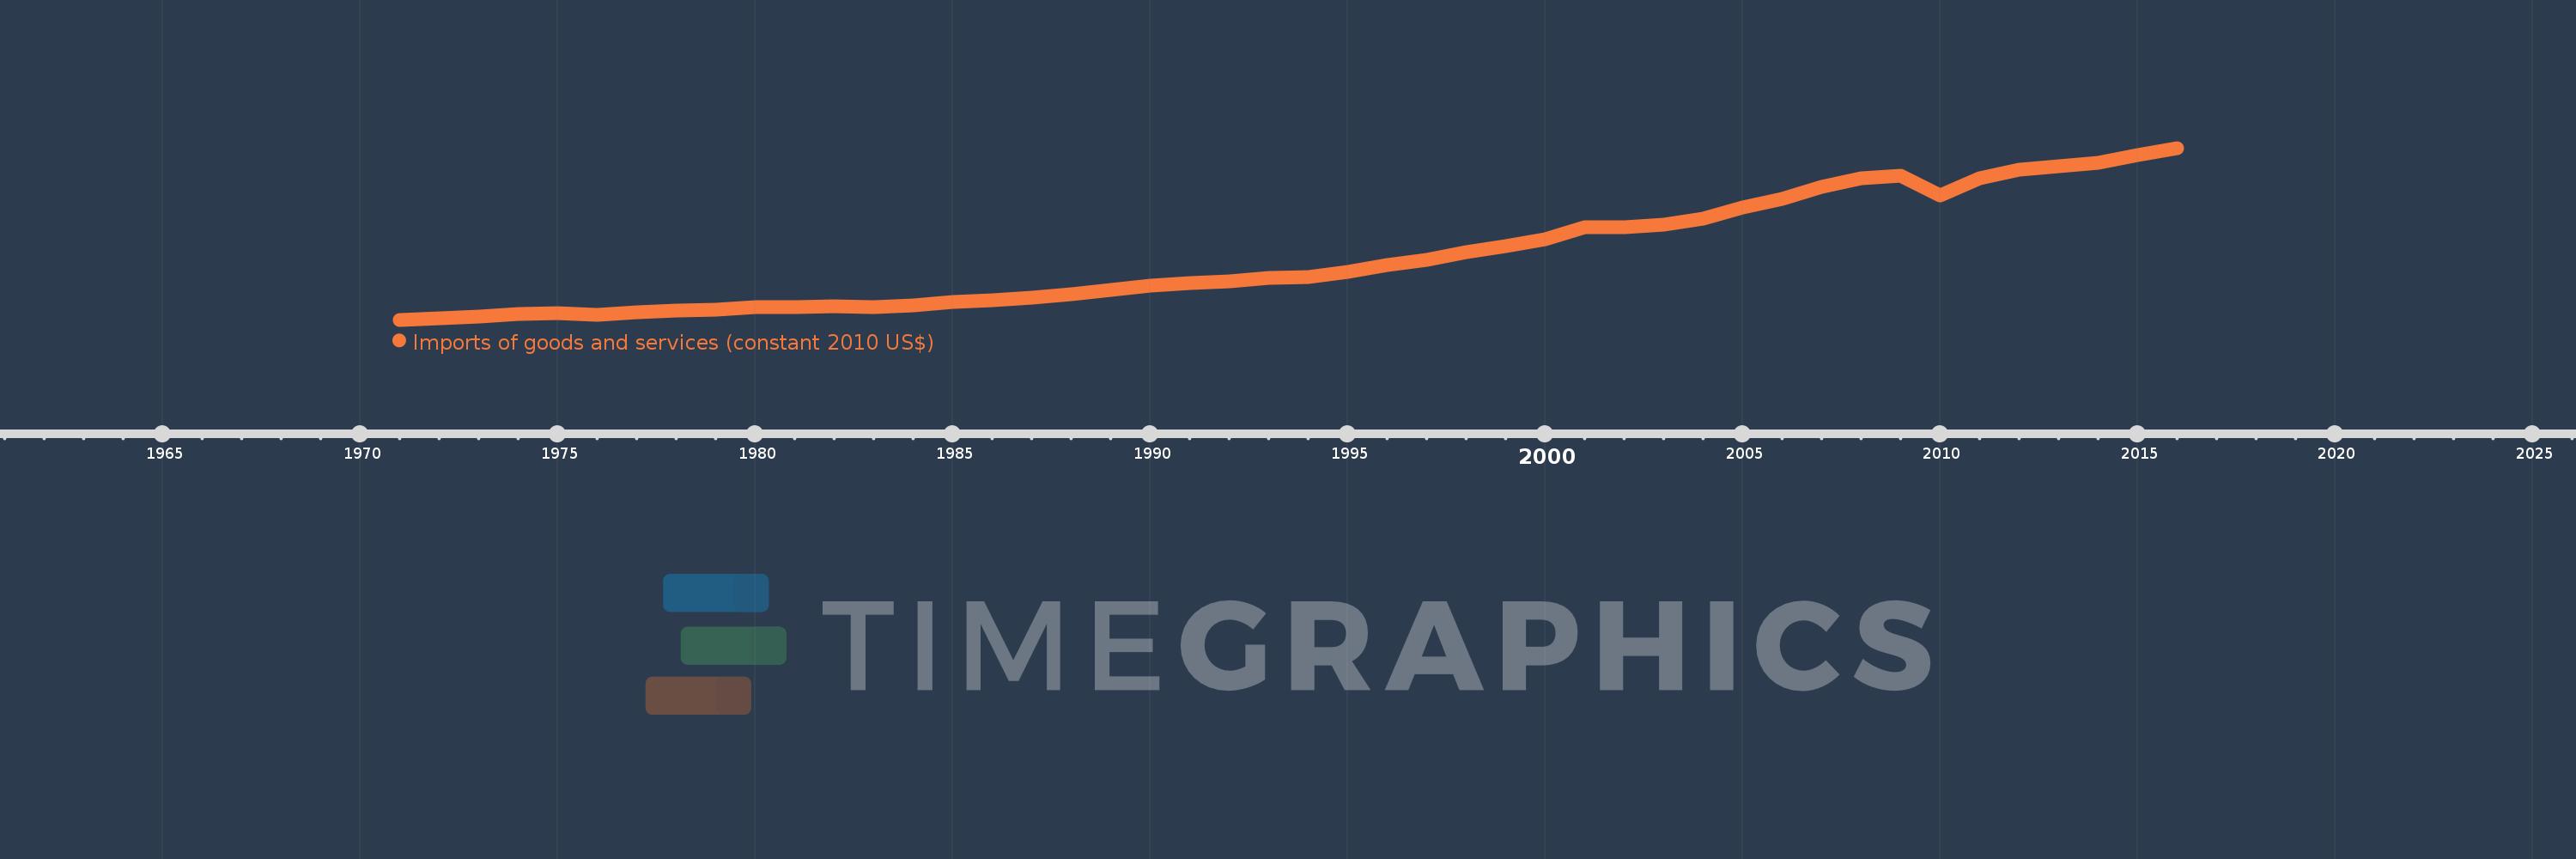
Imports of goods and services (constant 2010 US$)
2016,2015,2014,2013,2012,2011,2010,2009,2008,2007,2006,2005,2004,2003,2002,2001,2000,1999,1998,1997,1996,1995,1994,1993,1992,1991,1990,1989,1988,1987,1986,1985,1984,1983,1982,1981,1980,1979,1978,1977,1976,1975,1974,1973,1972,1971
This statistics in other country:
AfghanistanAlbaniaAlgeriaAngolaAntigua and BarbudaArab WorldArgentinaArmeniaArubaAustraliaAustriaAzerbaijanBahamas, TheBahrainBangladeshBarbadosBelarusBelgiumBelizeBeninBermudaBhutanBoliviaBosnia and HerzegovinaBotswanaBrazilBrunei DarussalamBulgariaBurkina FasoBurundiCabo VerdeCambodiaCameroonCanadaCaribbean small statesCentral African RepublicCentral Europe and the BalticsChadChileChinaColombiaComorosCongo, Dem. Rep.Congo, Rep.Costa RicaCote d'IvoireCroatiaCubaCyprusCzech RepublicDenmarkDominicaDominican RepublicEarly-demographic dividendEast Asia & PacificEast Asia & Pacific (excluding high income)East Asia & Pacific (IDA & IBRD countries)EcuadorEgypt, Arab Rep.El SalvadorEquatorial GuineaEritreaEstoniaEuro areaEurope & Central AsiaEurope & Central Asia (excluding high income)Europe & Central Asia (IDA & IBRD countries)European UnionFaroe IslandsFijiFinlandFragile and conflict affected situationsFranceGabonGambia, TheGeorgiaGermanyGhanaGreeceGrenadaGuatemalaGuineaGuinea-BissauGuyanaHaitiHeavily indebted poor countries (HIPC)High incomeHondurasHong Kong SAR, ChinaHungaryIBRD onlyIcelandIDA & IBRD totalIDA blendIDA onlyIDA totalIndiaIndonesiaIran, Islamic Rep.IraqIrelandIsraelItalyJamaicaJapanJordanKazakhstanKenyaKiribatiKorea, Rep.KosovoKuwaitKyrgyz RepublicLao PDRLate-demographic dividendLatin America & Caribbean Latin America & Caribbean (excluding high income)Latin America & the Caribbean (IDA & IBRD countries)LatviaLeast developed countries: UN classificationLebanonLiberiaLibyaLithuaniaLow & middle incomeLow incomeLower middle incomeLuxembourgMacao SAR, ChinaMacedonia, FYRMadagascarMalawiMalaysiaMaldivesMaliMaltaMauritaniaMauritiusMexicoMiddle East & North AfricaMiddle East & North Africa (excluding high income)Middle East & North Africa (IDA & IBRD countries)Middle incomeMoldovaMongoliaMontenegroMoroccoMozambiqueMyanmarNamibiaNepalNetherlandsNew ZealandNicaraguaNigerNigeriaNorth AmericaNorwayOECD membersOmanOther small statesPacific island small statesPakistanPalauPanamaParaguayPeruPhilippinesPolandPortugalPost-demographic dividendPre-demographic dividendPuerto RicoQatarRomaniaRussian FederationRwandaSamoaSaudi ArabiaSenegalSerbiaSeychellesSierra LeoneSingaporeSlovak RepublicSloveniaSmall statesSolomon IslandsSouth AfricaSouth AsiaSouth Asia (IDA & IBRD)South SudanSpainSri LankaSt. Kitts and NevisSt. LuciaSt. Vincent and the GrenadinesSub-Saharan Africa Sub-Saharan Africa (excluding high income)Sub-Saharan Africa (IDA & IBRD countries)SudanSurinameSwazilandSwedenSwitzerlandTajikistanTanzaniaThailandTimor-LesteTogoTongaTrinidad and TobagoTunisiaTurkeyTurkmenistanUgandaUkraineUnited Arab EmiratesUnited KingdomUnited StatesUpper middle incomeUruguayUzbekistanVanuatuVenezuela, RBVietnamWest Bank and GazaWorldYemen, Rep.ZambiaZimbabwe Timeline:
This timeline shows a graph from 1971 to 2016 of High income. No data until 1970. Number of actual observations by date: 46.
Source name:
World Development Indicators
Source organization:
World Bank national accounts data, and OECD National Accounts data files.
Categories, topics:
Economy & Growth, Trade
Last updated:
apr 23, 2017
Indicators value changes by year
Minimum:
1.647 trl
jan 1, 1971
Maximum:
15.577 trl
jan 1, 2016
At the date of observation
Value
Absolute change
Change from previous value
jan 1, 1971
1.647 trl
+1.647 trl
0.0%
jan 1, 1972
1.739 trl
+91.713 bln
5.57%
jan 1, 1973
1.9 trl
+161.199 bln
9.27%
jan 1, 1974
2.114 trl
+213.38 bln
11.23%
jan 1, 1975
2.168 trl
+54.116 bln
2.56%
jan 1, 1976
2.019 trl
-148.853 bln
-6.87%
jan 1, 1977
2.256 trl
+237.085 bln
11.74%
jan 1, 1978
2.361 trl
+105.326 bln
4.67%
jan 1, 1979
2.485 trl
+123.442 bln
5.23%
jan 1, 1980
2.697 trl
+212.649 bln
8.56%
jan 1, 1981
2.7 trl
+2.643 bln
0.1%
jan 1, 1982
2.707 trl
+6.511 bln
0.24%
jan 1, 1983
2.702 trl
-4.179 bln
-0.15%
jan 1, 1984
2.789 trl
+86.19 bln
3.19%
jan 1, 1985
3.087 trl
+298.24 bln
10.69%
jan 1, 1986
3.216 trl
+128.859 bln
4.17%
jan 1, 1987
3.427 trl
+210.859 bln
6.56%
jan 1, 1988
3.691 trl
+264.834 bln
7.73%
jan 1, 1989
4.035 trl
+343.398 bln
9.3%
jan 1, 1990
4.391 trl
+356.392 bln
8.83%
jan 1, 1991
4.652 trl
+260.742 bln
5.94%
jan 1, 1992
4.791 trl
+139.458 bln
3.0%
jan 1, 1993
5.007 trl
+215.766 bln
4.5%
jan 1, 1994
5.074 trl
+66.897 bln
1.34%
jan 1, 1995
5.558 trl
+484.15 bln
9.54%
jan 1, 1996
6.069 trl
+510.399 bln
9.18%
jan 1, 1997
6.501 trl
+432.388 bln
7.12%
jan 1, 1998
7.14 trl
+638.673 bln
9.82%
jan 1, 1999
7.597 trl
+457.572 bln
6.41%
jan 1, 2000
8.163 trl
+565.685 bln
7.45%
jan 1, 2001
9.154 trl
+990.867 bln
12.14%
jan 1, 2002
9.151 trl
-3.128 bln
-0.03%
jan 1, 2003
9.383 trl
+231.913 bln
2.53%
jan 1, 2004
9.811 trl
+428.8 bln
4.57%
jan 1, 2005
10.75 trl
+938.205 bln
9.56%
jan 1, 2006
11.475 trl
+725.498 bln
6.75%
jan 1, 2007
12.406 trl
+930.904 bln
8.11%
jan 1, 2008
13.142 trl
+735.701 bln
5.93%
jan 1, 2009
13.302 trl
+160.468 bln
1.22%
jan 1, 2010
11.757 trl
-1.545 trl
-11.61%
jan 1, 2011
13.094 trl
+1.337 trl
11.37%
jan 1, 2012
13.835 trl
+740.599 bln
5.66%
jan 1, 2013
14.059 trl
+223.886 bln
1.62%
jan 1, 2014
14.397 trl
+338.644 bln
2.41%
jan 1, 2015
14.987 trl
+589.849 bln
4.1%
jan 1, 2016
15.577 trl
+589.703 bln
3.93%
Ranking of countries by current statistics by years


Comments: