29
/
en
AIzaSyAYiBZKx7MnpbEhh9jyipgxe19OcubqV5w
April 1, 2024
29948
Euro area
EMU
false
2
1
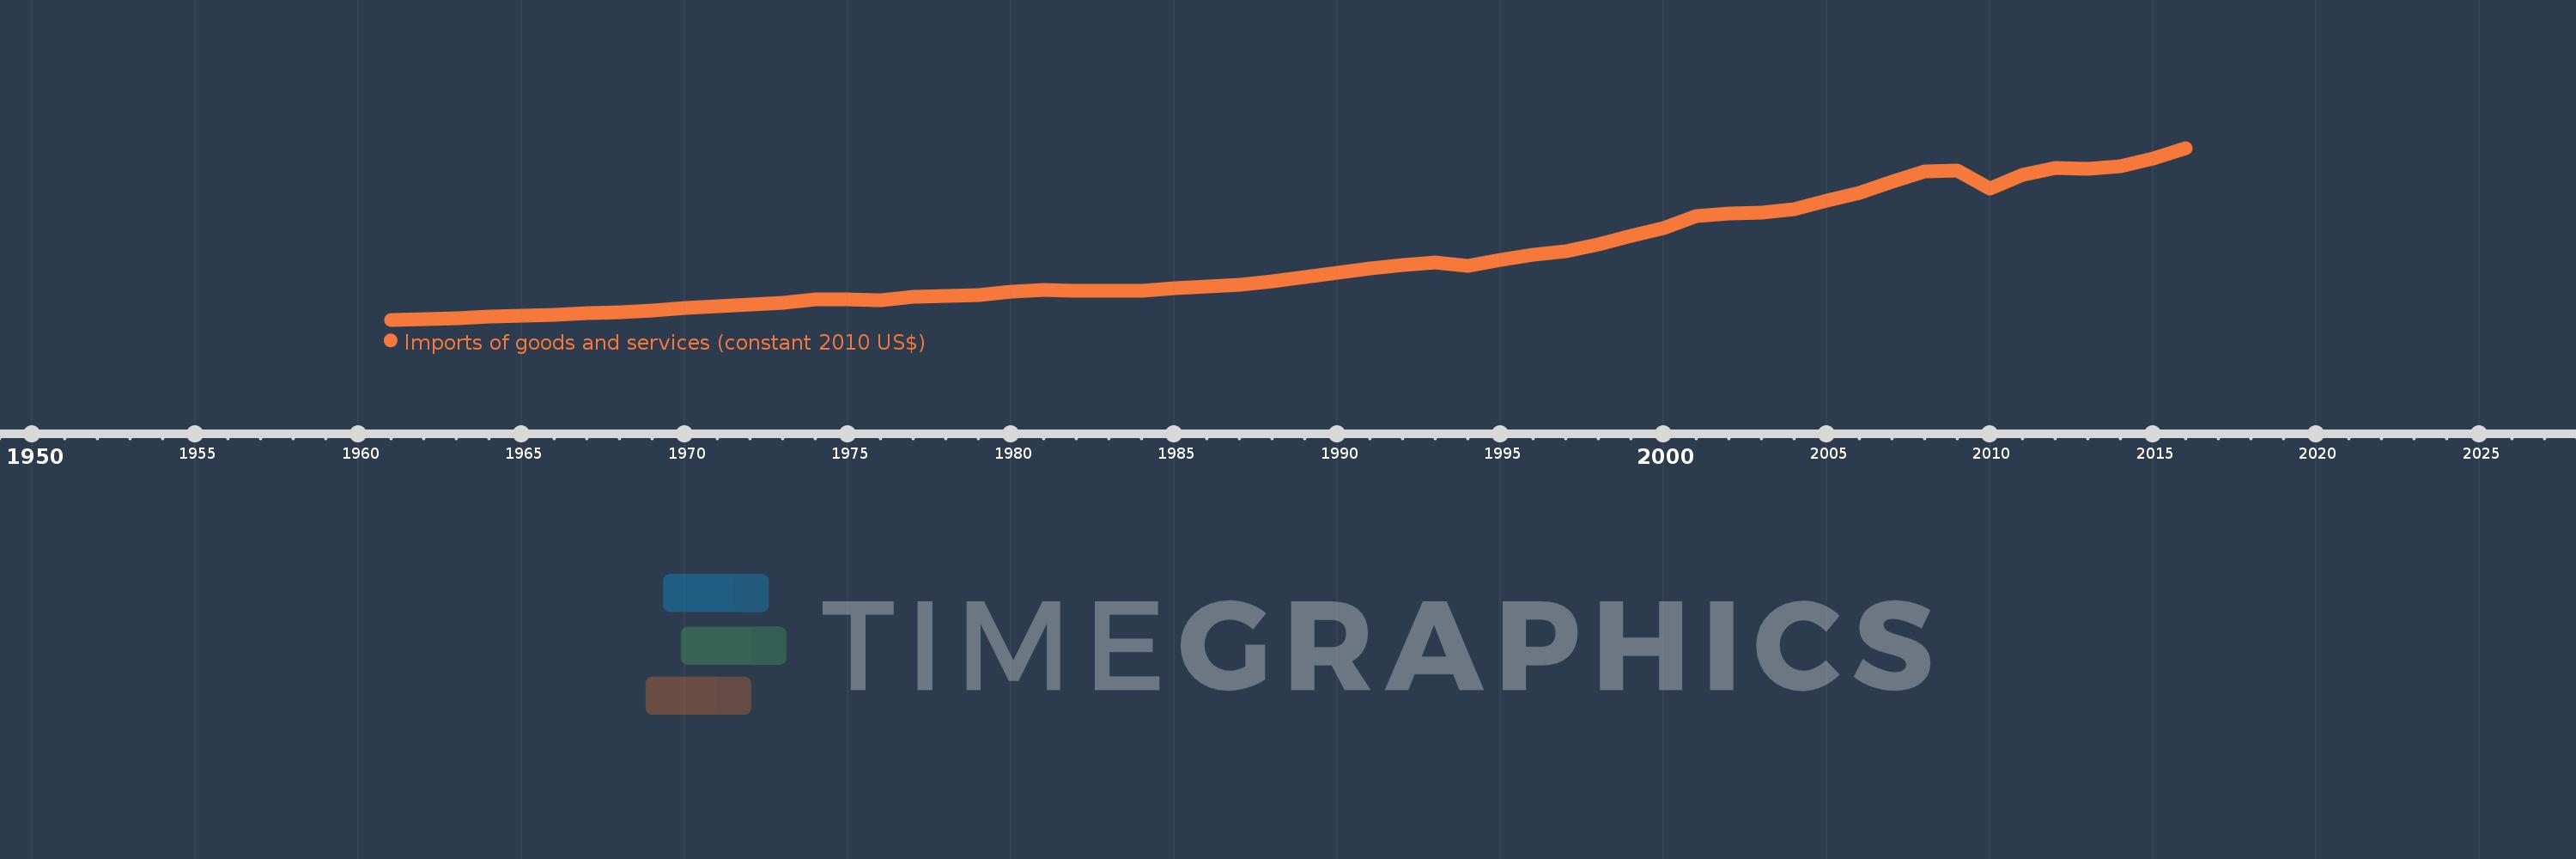
Imports of goods and services (constant 2010 US$)
2016,2015,2014,2013,2012,2011,2010,2009,2008,2007,2006,2005,2004,2003,2002,2001,2000,1999,1998,1997,1996,1995,1994,1993,1992,1991,1990,1989,1988,1987,1986,1985,1984,1983,1982,1981,1980,1979,1978,1977,1976,1975,1974,1973,1972,1971,1970,1969,1968,1967,1966,1965,1964,1963,1962,1961
This statistics in other country:
AfghanistanAlbaniaAlgeriaAngolaAntigua and BarbudaArab WorldArgentinaArmeniaArubaAustraliaAustriaAzerbaijanBahamas, TheBahrainBangladeshBarbadosBelarusBelgiumBelizeBeninBermudaBhutanBoliviaBosnia and HerzegovinaBotswanaBrazilBrunei DarussalamBulgariaBurkina FasoBurundiCabo VerdeCambodiaCameroonCanadaCaribbean small statesCentral African RepublicCentral Europe and the BalticsChadChileChinaColombiaComorosCongo, Dem. Rep.Congo, Rep.Costa RicaCote d'IvoireCroatiaCubaCyprusCzech RepublicDenmarkDominicaDominican RepublicEarly-demographic dividendEast Asia & PacificEast Asia & Pacific (excluding high income)East Asia & Pacific (IDA & IBRD countries)EcuadorEgypt, Arab Rep.El SalvadorEquatorial GuineaEritreaEstoniaEuro areaEurope & Central AsiaEurope & Central Asia (excluding high income)Europe & Central Asia (IDA & IBRD countries)European UnionFaroe IslandsFijiFinlandFragile and conflict affected situationsFranceGabonGambia, TheGeorgiaGermanyGhanaGreeceGrenadaGuatemalaGuineaGuinea-BissauGuyanaHaitiHeavily indebted poor countries (HIPC)High incomeHondurasHong Kong SAR, ChinaHungaryIBRD onlyIcelandIDA & IBRD totalIDA blendIDA onlyIDA totalIndiaIndonesiaIran, Islamic Rep.IraqIrelandIsraelItalyJamaicaJapanJordanKazakhstanKenyaKiribatiKorea, Rep.KosovoKuwaitKyrgyz RepublicLao PDRLate-demographic dividendLatin America & Caribbean Latin America & Caribbean (excluding high income)Latin America & the Caribbean (IDA & IBRD countries)LatviaLeast developed countries: UN classificationLebanonLiberiaLibyaLithuaniaLow & middle incomeLow incomeLower middle incomeLuxembourgMacao SAR, ChinaMacedonia, FYRMadagascarMalawiMalaysiaMaldivesMaliMaltaMauritaniaMauritiusMexicoMiddle East & North AfricaMiddle East & North Africa (excluding high income)Middle East & North Africa (IDA & IBRD countries)Middle incomeMoldovaMongoliaMontenegroMoroccoMozambiqueMyanmarNamibiaNepalNetherlandsNew ZealandNicaraguaNigerNigeriaNorth AmericaNorwayOECD membersOmanOther small statesPacific island small statesPakistanPalauPanamaParaguayPeruPhilippinesPolandPortugalPost-demographic dividendPre-demographic dividendPuerto RicoQatarRomaniaRussian FederationRwandaSamoaSaudi ArabiaSenegalSerbiaSeychellesSierra LeoneSingaporeSlovak RepublicSloveniaSmall statesSolomon IslandsSouth AfricaSouth AsiaSouth Asia (IDA & IBRD)South SudanSpainSri LankaSt. Kitts and NevisSt. LuciaSt. Vincent and the GrenadinesSub-Saharan Africa Sub-Saharan Africa (excluding high income)Sub-Saharan Africa (IDA & IBRD countries)SudanSurinameSwazilandSwedenSwitzerlandTajikistanTanzaniaThailandTimor-LesteTogoTongaTrinidad and TobagoTunisiaTurkeyTurkmenistanUgandaUkraineUnited Arab EmiratesUnited KingdomUnited StatesUpper middle incomeUruguayUzbekistanVanuatuVenezuela, RBVietnamWest Bank and GazaWorldYemen, Rep.ZambiaZimbabwe Timeline:
This timeline shows a graph from 1961 to 2016 of Euro area. No data until 1960. Number of actual observations by date: 56.
Source name:
World Development Indicators
Source organization:
World Bank national accounts data, and OECD National Accounts data files.
Categories, topics:
Economy & Growth, Trade
Last updated:
apr 23, 2017
Indicators value changes by year
Minimum:
271.088 bln
jan 1, 1961
Maximum:
5.59 trl
jan 1, 2016
At the date of observation
Value
Absolute change
Change from previous value
jan 1, 1961
271.088 bln
+271.088 bln
0.0%
jan 1, 1962
297.082 bln
+25.994 bln
9.59%
jan 1, 1963
324.397 bln
+27.315 bln
9.19%
jan 1, 1964
367.89 bln
+43.493 bln
13.41%
jan 1, 1965
400.653 bln
+32.763 bln
8.91%
jan 1, 1966
425.474 bln
+24.822 bln
6.2%
jan 1, 1967
468.132 bln
+42.658 bln
10.03%
jan 1, 1968
494.857 bln
+26.725 bln
5.71%
jan 1, 1969
545.866 bln
+51.009 bln
10.31%
jan 1, 1970
635.568 bln
+89.702 bln
16.43%
jan 1, 1971
693.957 bln
+58.389 bln
9.19%
jan 1, 1972
733.012 bln
+39.055 bln
5.63%
jan 1, 1973
803.064 bln
+70.052 bln
9.56%
jan 1, 1974
890.039 bln
+86.974 bln
10.83%
jan 1, 1975
912.516 bln
+22.478 bln
2.53%
jan 1, 1976
863.493 bln
-49.023 bln
-5.37%
jan 1, 1977
970.677 bln
+107.184 bln
12.41%
jan 1, 1978
1.001 trl
+30.035 bln
3.09%
jan 1, 1979
1.045 trl
+44.692 bln
4.47%
jan 1, 1980
1.147 trl
+101.316 bln
9.69%
jan 1, 1981
1.185 trl
+38.572 bln
3.36%
jan 1, 1982
1.164 trl
-21.432 bln
-1.81%
jan 1, 1983
1.17 trl
+5.796 bln
0.5%
jan 1, 1984
1.174 trl
+3.971 bln
0.34%
jan 1, 1985
1.242 trl
+68.446 bln
5.83%
jan 1, 1986
1.294 trl
+52.366 bln
4.22%
jan 1, 1987
1.358 trl
+63.202 bln
4.88%
jan 1, 1988
1.464 trl
+106.256 bln
7.83%
jan 1, 1989
1.583 trl
+118.844 bln
8.12%
jan 1, 1990
1.73 trl
+147.115 bln
9.29%
jan 1, 1991
1.863 trl
+133.023 bln
7.69%
jan 1, 1992
1.964 trl
+100.987 bln
5.42%
jan 1, 1993
2.039 trl
+74.93 bln
3.82%
jan 1, 1994
1.946 trl
-93.271 bln
-4.57%
jan 1, 1995
2.113 trl
+167.479 bln
8.61%
jan 1, 1996
2.287 trl
+173.653 bln
8.22%
jan 1, 1997
2.383 trl
+96.75 bln
4.23%
jan 1, 1998
2.616 trl
+232.452 bln
9.75%
jan 1, 1999
2.88 trl
+264.345 bln
10.11%
jan 1, 2000
3.102 trl
+221.421 bln
7.69%
jan 1, 2001
3.473 trl
+371.529 bln
11.98%
jan 1, 2002
3.558 trl
+84.856 bln
2.44%
jan 1, 2003
3.58 trl
+22.042 bln
0.62%
jan 1, 2004
3.691 trl
+111.165 bln
3.11%
jan 1, 2005
3.956 trl
+264.386 bln
7.16%
jan 1, 2006
4.193 trl
+237.536 bln
6.01%
jan 1, 2007
4.55 trl
+356.885 bln
8.51%
jan 1, 2008
4.856 trl
+305.559 bln
6.72%
jan 1, 2009
4.89 trl
+34.389 bln
0.71%
jan 1, 2010
4.341 trl
-549.059 bln
-11.23%
jan 1, 2011
4.768 trl
+426.934 bln
9.84%
jan 1, 2012
4.98 trl
+212.156 bln
4.45%
jan 1, 2013
4.942 trl
-37.748 bln
-0.76%
jan 1, 2014
5.013 trl
+70.44 bln
1.43%
jan 1, 2015
5.255 trl
+241.946 bln
4.83%
jan 1, 2016
5.59 trl
+334.947 bln
6.37%
Ranking of countries by current statistics by years


Comments: