29
/
en
AIzaSyAYiBZKx7MnpbEhh9jyipgxe19OcubqV5w
April 1, 2024
87358
Bolivia
BOL
true
2
1
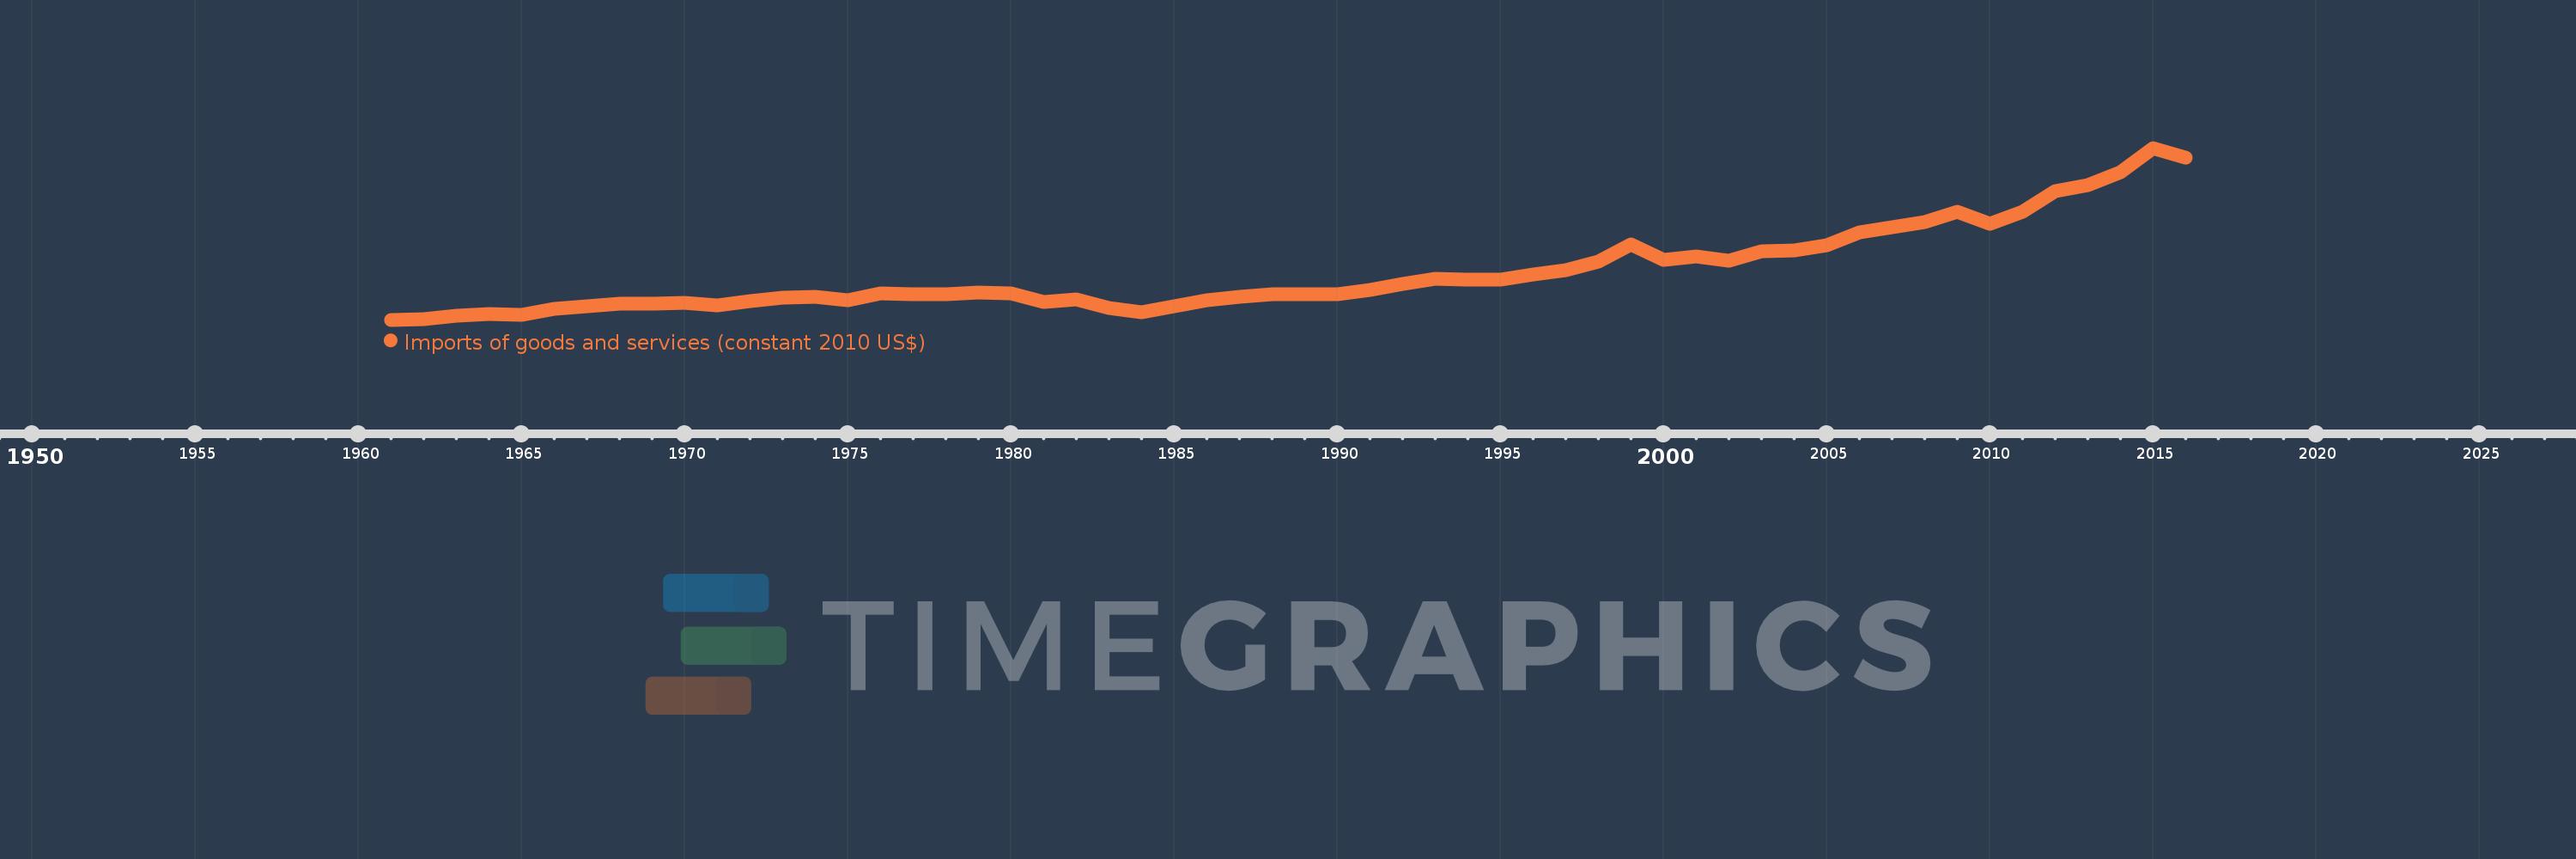
Imports of goods and services (constant 2010 US$)
2016,2015,2014,2013,2012,2011,2010,2009,2008,2007,2006,2005,2004,2003,2002,2001,2000,1999,1998,1997,1996,1995,1994,1993,1992,1991,1990,1989,1988,1987,1986,1985,1984,1983,1982,1981,1980,1979,1978,1977,1976,1975,1974,1973,1972,1971,1970,1969,1968,1967,1966,1965,1964,1963,1962,1961
This statistics in other country:
AfghanistanAlbaniaAlgeriaAngolaAntigua and BarbudaArab WorldArgentinaArmeniaArubaAustraliaAustriaAzerbaijanBahamas, TheBahrainBangladeshBarbadosBelarusBelgiumBelizeBeninBermudaBhutanBoliviaBosnia and HerzegovinaBotswanaBrazilBrunei DarussalamBulgariaBurkina FasoBurundiCabo VerdeCambodiaCameroonCanadaCaribbean small statesCentral African RepublicCentral Europe and the BalticsChadChileChinaColombiaComorosCongo, Dem. Rep.Congo, Rep.Costa RicaCote d'IvoireCroatiaCubaCyprusCzech RepublicDenmarkDominicaDominican RepublicEarly-demographic dividendEast Asia & PacificEast Asia & Pacific (excluding high income)East Asia & Pacific (IDA & IBRD countries)EcuadorEgypt, Arab Rep.El SalvadorEquatorial GuineaEritreaEstoniaEuro areaEurope & Central AsiaEurope & Central Asia (excluding high income)Europe & Central Asia (IDA & IBRD countries)European UnionFaroe IslandsFijiFinlandFragile and conflict affected situationsFranceGabonGambia, TheGeorgiaGermanyGhanaGreeceGrenadaGuatemalaGuineaGuinea-BissauGuyanaHaitiHeavily indebted poor countries (HIPC)High incomeHondurasHong Kong SAR, ChinaHungaryIBRD onlyIcelandIDA & IBRD totalIDA blendIDA onlyIDA totalIndiaIndonesiaIran, Islamic Rep.IraqIrelandIsraelItalyJamaicaJapanJordanKazakhstanKenyaKiribatiKorea, Rep.KosovoKuwaitKyrgyz RepublicLao PDRLate-demographic dividendLatin America & Caribbean Latin America & Caribbean (excluding high income)Latin America & the Caribbean (IDA & IBRD countries)LatviaLeast developed countries: UN classificationLebanonLiberiaLibyaLithuaniaLow & middle incomeLow incomeLower middle incomeLuxembourgMacao SAR, ChinaMacedonia, FYRMadagascarMalawiMalaysiaMaldivesMaliMaltaMauritaniaMauritiusMexicoMiddle East & North AfricaMiddle East & North Africa (excluding high income)Middle East & North Africa (IDA & IBRD countries)Middle incomeMoldovaMongoliaMontenegroMoroccoMozambiqueMyanmarNamibiaNepalNetherlandsNew ZealandNicaraguaNigerNigeriaNorth AmericaNorwayOECD membersOmanOther small statesPacific island small statesPakistanPalauPanamaParaguayPeruPhilippinesPolandPortugalPost-demographic dividendPre-demographic dividendPuerto RicoQatarRomaniaRussian FederationRwandaSamoaSaudi ArabiaSenegalSerbiaSeychellesSierra LeoneSingaporeSlovak RepublicSloveniaSmall statesSolomon IslandsSouth AfricaSouth AsiaSouth Asia (IDA & IBRD)South SudanSpainSri LankaSt. Kitts and NevisSt. LuciaSt. Vincent and the GrenadinesSub-Saharan Africa Sub-Saharan Africa (excluding high income)Sub-Saharan Africa (IDA & IBRD countries)SudanSurinameSwazilandSwedenSwitzerlandTajikistanTanzaniaThailandTimor-LesteTogoTongaTrinidad and TobagoTunisiaTurkeyTurkmenistanUgandaUkraineUnited Arab EmiratesUnited KingdomUnited StatesUpper middle incomeUruguayUzbekistanVanuatuVenezuela, RBVietnamWest Bank and GazaWorldYemen, Rep.ZambiaZimbabwe Timeline:
This timeline shows a graph from 1961 to 2016 of Bolivia. No data until 1960. Number of actual observations by date: 56.
Source name:
World Development Indicators
Source organization:
World Bank national accounts data, and OECD National Accounts data files.
Categories, topics:
Economy & Growth, Trade
Last updated:
apr 23, 2017
Indicators value changes by year
Minimum:
844.971 mln
jan 1, 1961
Maximum:
10.246 bln
jan 1, 2015
At the date of observation
Value
Absolute change
Change from previous value
jan 1, 1961
844.971 mln
+844.971 mln
0.0%
jan 1, 1962
894.444 mln
+49.473 mln
5.86%
jan 1, 1963
1.059 bln
+164.911 mln
18.44%
jan 1, 1964
1.141 bln
+81.706 mln
7.71%
jan 1, 1965
1.092 bln
-49.305 mln
-4.32%
jan 1, 1966
1.442 bln
+350.066 mln
32.06%
jan 1, 1967
1.573 bln
+131.011 mln
9.09%
jan 1, 1968
1.709 bln
+136.645 mln
8.69%
jan 1, 1969
1.726 bln
+16.2 mln
0.95%
jan 1, 1970
1.748 bln
+22.539 mln
1.31%
jan 1, 1971
1.634 bln
-114.509 mln
-6.55%
jan 1, 1972
1.862 bln
+228.728 mln
14.0%
jan 1, 1973
2.065 bln
+202.858 mln
10.89%
jan 1, 1974
2.107 bln
+41.48 mln
2.01%
jan 1, 1975
1.897 bln
-210.26 mln
-9.98%
jan 1, 1976
2.265 bln
+368.266 mln
19.42%
jan 1, 1977
2.254 bln
-10.407 mln
-0.46%
jan 1, 1978
2.235 bln
-19.421 mln
-0.86%
jan 1, 1979
2.324 bln
+88.97 mln
3.98%
jan 1, 1980
2.297 bln
-27.336 mln
-1.18%
jan 1, 1981
1.817 bln
-479.442 mln
-20.88%
jan 1, 1982
1.966 bln
+149.303 mln
8.22%
jan 1, 1983
1.471 bln
-495.657 mln
-25.21%
jan 1, 1984
1.277 bln
-193.506 mln
-13.16%
jan 1, 1985
1.587 bln
+309.582 mln
24.24%
jan 1, 1986
1.917 bln
+329.648 mln
20.77%
jan 1, 1987
2.088 bln
+171.411 mln
8.94%
jan 1, 1988
2.249 bln
+161.48 mln
7.73%
jan 1, 1989
2.245 bln
-3.957 mln
-0.18%
jan 1, 1990
2.253 bln
+7.225 mln
0.32%
jan 1, 1991
2.483 bln
+230.751 mln
10.24%
jan 1, 1992
2.796 bln
+312.646 mln
12.59%
jan 1, 1993
3.074 bln
+277.483 mln
9.92%
jan 1, 1994
3.051 bln
-22.388 mln
-0.73%
jan 1, 1995
3.031 bln
-19.669 mln
-0.64%
jan 1, 1996
3.302 bln
+270.399 mln
8.92%
jan 1, 1997
3.564 bln
+262.179 mln
7.94%
jan 1, 1998
4.047 bln
+482.544 mln
13.54%
jan 1, 1999
4.949 bln
+902.832 mln
22.31%
jan 1, 2000
4.101 bln
-848.379 mln
-17.14%
jan 1, 2001
4.293 bln
+191.516 mln
4.67%
jan 1, 2002
4.076 bln
-216.347 mln
-5.04%
jan 1, 2003
4.61 bln
+533.784 mln
13.1%
jan 1, 2004
4.652 bln
+42.183 mln
0.92%
jan 1, 2005
4.906 bln
+254.265 mln
5.47%
jan 1, 2006
5.632 bln
+725.5 mln
14.79%
jan 1, 2007
5.923 bln
+290.632 mln
5.16%
jan 1, 2008
6.181 bln
+258.787 mln
4.37%
jan 1, 2009
6.765 bln
+583.391 mln
9.44%
jan 1, 2010
6.074 bln
-690.929 mln
-10.21%
jan 1, 2011
6.745 bln
+670.766 mln
11.04%
jan 1, 2012
7.892 bln
+1.147 bln
17.01%
jan 1, 2013
8.23 bln
+338.071 mln
4.28%
jan 1, 2014
8.903 bln
+673.454 mln
8.18%
jan 1, 2015
10.246 bln
+1.342 bln
15.08%
jan 1, 2016
9.72 bln
-525.59 mln
-5.13%
Ranking of countries by current statistics by years


Comments: