29
/
en
AIzaSyAYiBZKx7MnpbEhh9jyipgxe19OcubqV5w
April 1, 2024
38242
IDA blend
IDB
false
2
1
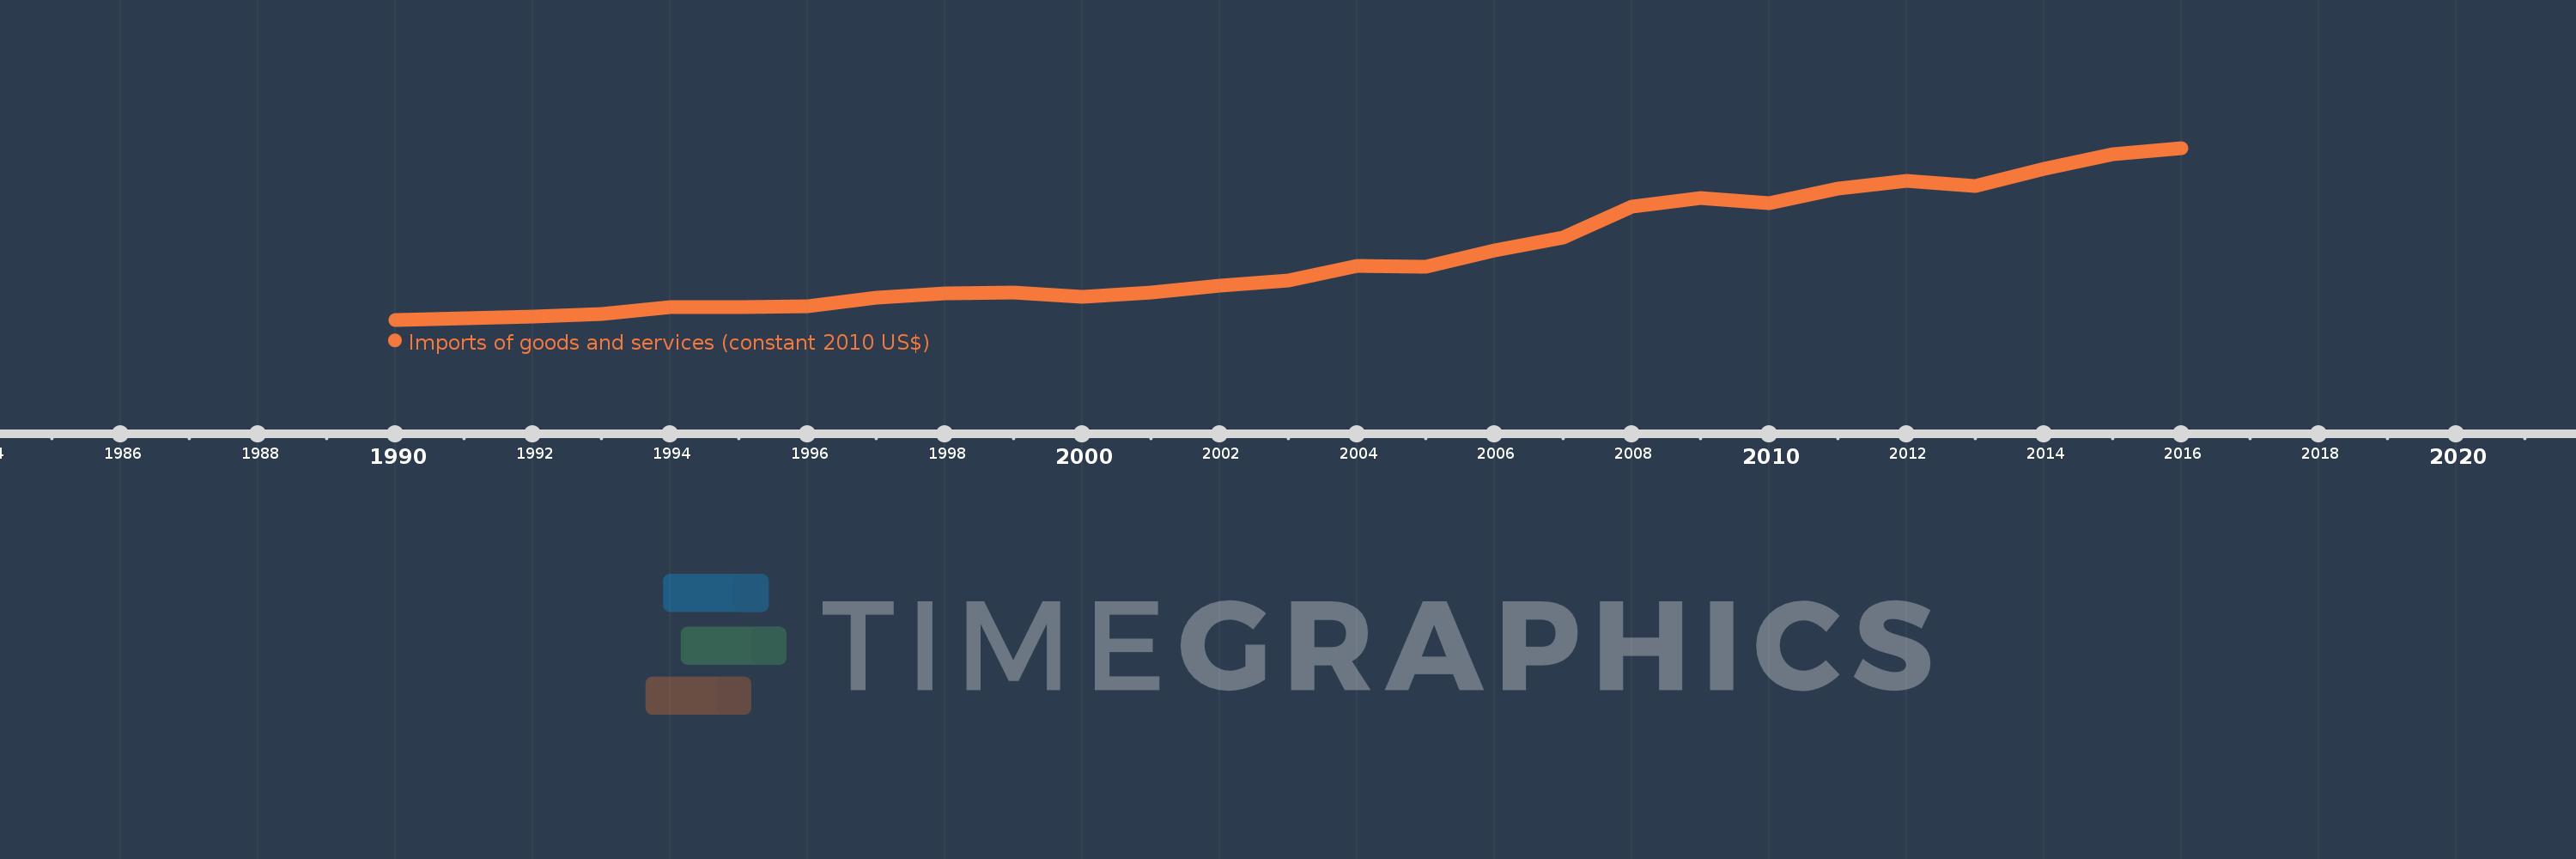
Imports of goods and services (constant 2010 US$)
2016,2015,2014,2013,2012,2011,2010,2009,2008,2007,2006,2005,2004,2003,2002,2001,2000,1999,1998,1997,1996,1995,1994,1993,1992,1991,1990
This statistics in other country:
AfghanistanAlbaniaAlgeriaAngolaAntigua and BarbudaArab WorldArgentinaArmeniaArubaAustraliaAustriaAzerbaijanBahamas, TheBahrainBangladeshBarbadosBelarusBelgiumBelizeBeninBermudaBhutanBoliviaBosnia and HerzegovinaBotswanaBrazilBrunei DarussalamBulgariaBurkina FasoBurundiCabo VerdeCambodiaCameroonCanadaCaribbean small statesCentral African RepublicCentral Europe and the BalticsChadChileChinaColombiaComorosCongo, Dem. Rep.Congo, Rep.Costa RicaCote d'IvoireCroatiaCubaCyprusCzech RepublicDenmarkDominicaDominican RepublicEarly-demographic dividendEast Asia & PacificEast Asia & Pacific (excluding high income)East Asia & Pacific (IDA & IBRD countries)EcuadorEgypt, Arab Rep.El SalvadorEquatorial GuineaEritreaEstoniaEuro areaEurope & Central AsiaEurope & Central Asia (excluding high income)Europe & Central Asia (IDA & IBRD countries)European UnionFaroe IslandsFijiFinlandFragile and conflict affected situationsFranceGabonGambia, TheGeorgiaGermanyGhanaGreeceGrenadaGuatemalaGuineaGuinea-BissauGuyanaHaitiHeavily indebted poor countries (HIPC)High incomeHondurasHong Kong SAR, ChinaHungaryIBRD onlyIcelandIDA & IBRD totalIDA blendIDA onlyIDA totalIndiaIndonesiaIran, Islamic Rep.IraqIrelandIsraelItalyJamaicaJapanJordanKazakhstanKenyaKiribatiKorea, Rep.KosovoKuwaitKyrgyz RepublicLao PDRLate-demographic dividendLatin America & Caribbean Latin America & Caribbean (excluding high income)Latin America & the Caribbean (IDA & IBRD countries)LatviaLeast developed countries: UN classificationLebanonLiberiaLibyaLithuaniaLow & middle incomeLow incomeLower middle incomeLuxembourgMacao SAR, ChinaMacedonia, FYRMadagascarMalawiMalaysiaMaldivesMaliMaltaMauritaniaMauritiusMexicoMiddle East & North AfricaMiddle East & North Africa (excluding high income)Middle East & North Africa (IDA & IBRD countries)Middle incomeMoldovaMongoliaMontenegroMoroccoMozambiqueMyanmarNamibiaNepalNetherlandsNew ZealandNicaraguaNigerNigeriaNorth AmericaNorwayOECD membersOmanOther small statesPacific island small statesPakistanPalauPanamaParaguayPeruPhilippinesPolandPortugalPost-demographic dividendPre-demographic dividendPuerto RicoQatarRomaniaRussian FederationRwandaSamoaSaudi ArabiaSenegalSerbiaSeychellesSierra LeoneSingaporeSlovak RepublicSloveniaSmall statesSolomon IslandsSouth AfricaSouth AsiaSouth Asia (IDA & IBRD)South SudanSpainSri LankaSt. Kitts and NevisSt. LuciaSt. Vincent and the GrenadinesSub-Saharan Africa Sub-Saharan Africa (excluding high income)Sub-Saharan Africa (IDA & IBRD countries)SudanSurinameSwazilandSwedenSwitzerlandTajikistanTanzaniaThailandTimor-LesteTogoTongaTrinidad and TobagoTunisiaTurkeyTurkmenistanUgandaUkraineUnited Arab EmiratesUnited KingdomUnited StatesUpper middle incomeUruguayUzbekistanVanuatuVenezuela, RBVietnamWest Bank and GazaWorldYemen, Rep.ZambiaZimbabwe Timeline:
This timeline shows a graph from 1990 to 2016 of IDA blend. No data until 1989. Number of actual observations by date: 27.
Source name:
World Development Indicators
Source organization:
World Bank national accounts data, and OECD National Accounts data files.
Categories, topics:
Economy & Growth, Trade
Last updated:
apr 23, 2017
Indicators value changes by year
Minimum:
49.885 bln
jan 1, 1990
Maximum:
325.222 bln
jan 1, 2016
At the date of observation
Value
Absolute change
Change from previous value
jan 1, 1990
49.885 bln
+49.885 bln
0.0%
jan 1, 1991
51.59 bln
+1.705 bln
3.42%
jan 1, 1992
55.239 bln
+3.649 bln
7.07%
jan 1, 1993
59.672 bln
+4.433 bln
8.02%
jan 1, 1994
70.14 bln
+10.468 bln
17.54%
jan 1, 1995
69.928 bln
-212.309 mln
-0.3%
jan 1, 1996
71.736 bln
+1.808 bln
2.59%
jan 1, 1997
84.667 bln
+12.931 bln
18.03%
jan 1, 1998
92.691 bln
+8.024 bln
9.48%
jan 1, 1999
93.166 bln
+474.443 mln
0.51%
jan 1, 2000
86.229 bln
-6.937 bln
-7.45%
jan 1, 2001
92.842 bln
+6.614 bln
7.67%
jan 1, 2002
105.106 bln
+12.264 bln
13.21%
jan 1, 2003
113.26 bln
+8.154 bln
7.76%
jan 1, 2004
136.464 bln
+23.204 bln
20.49%
jan 1, 2005
134.794 bln
-1.669 bln
-1.22%
jan 1, 2006
161.444 bln
+26.65 bln
19.77%
jan 1, 2007
181.693 bln
+20.248 bln
12.54%
jan 1, 2008
230.693 bln
+49.0 bln
26.97%
jan 1, 2009
244.887 bln
+14.193 bln
6.15%
jan 1, 2010
236.219 bln
-8.668 bln
-3.54%
jan 1, 2011
259.872 bln
+23.654 bln
10.01%
jan 1, 2012
272.775 bln
+12.902 bln
4.96%
jan 1, 2013
264.304 bln
-8.471 bln
-3.11%
jan 1, 2014
292.384 bln
+28.08 bln
10.62%
jan 1, 2015
315.665 bln
+23.281 bln
7.96%
jan 1, 2016
325.222 bln
+9.557 bln
3.03%
Ranking of countries by current statistics by years


Comments: