29
/
en
AIzaSyAYiBZKx7MnpbEhh9jyipgxe19OcubqV5w
April 1, 2024
115901
Cuba
CUB
true
2
1
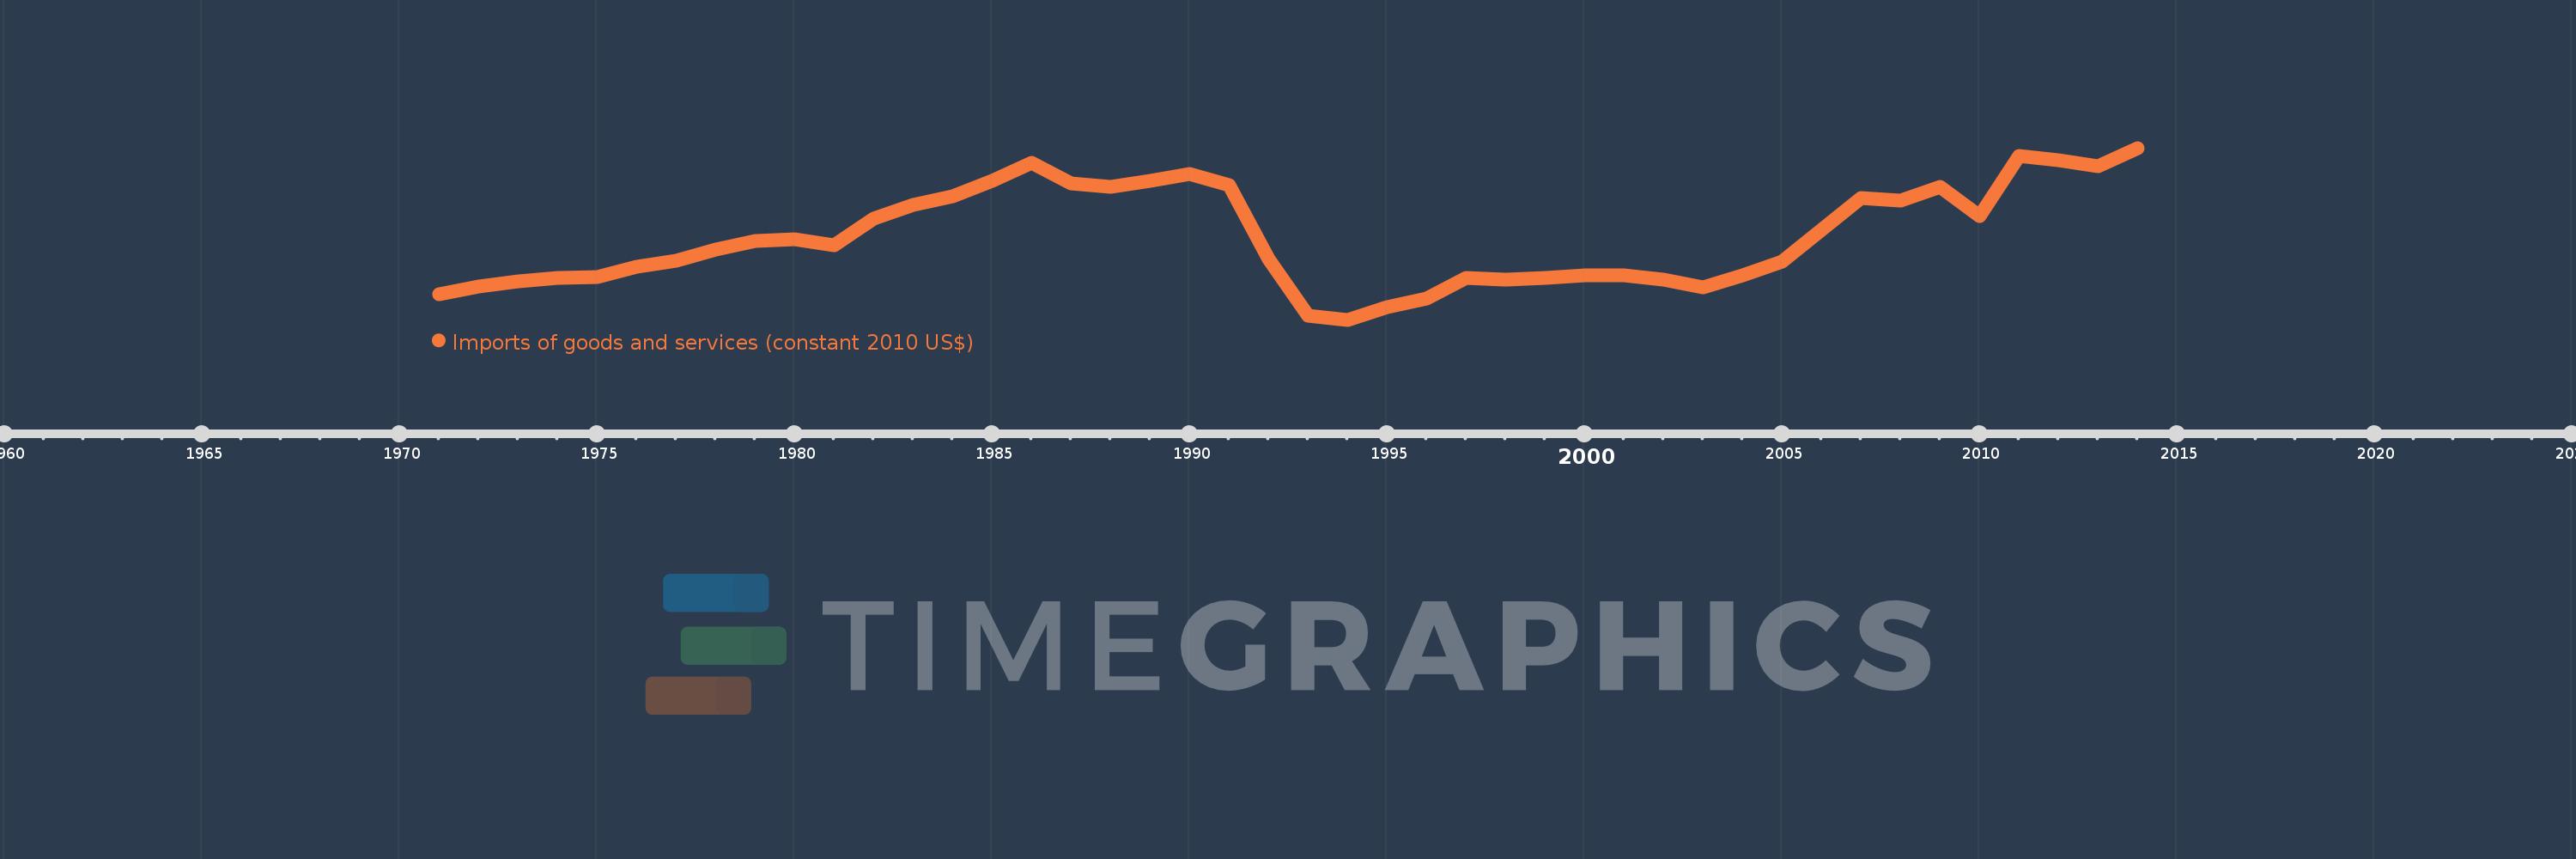
Imports of goods and services (constant 2010 US$)
2014,2013,2012,2011,2010,2009,2008,2007,2006,2005,2004,2003,2002,2001,2000,1999,1998,1997,1996,1995,1994,1993,1992,1991,1990,1989,1988,1987,1986,1985,1984,1983,1982,1981,1980,1979,1978,1977,1976,1975,1974,1973,1972,1971
This statistics in other country:
AfghanistanAlbaniaAlgeriaAngolaAntigua and BarbudaArab WorldArgentinaArmeniaArubaAustraliaAustriaAzerbaijanBahamas, TheBahrainBangladeshBarbadosBelarusBelgiumBelizeBeninBermudaBhutanBoliviaBosnia and HerzegovinaBotswanaBrazilBrunei DarussalamBulgariaBurkina FasoBurundiCabo VerdeCambodiaCameroonCanadaCaribbean small statesCentral African RepublicCentral Europe and the BalticsChadChileChinaColombiaComorosCongo, Dem. Rep.Congo, Rep.Costa RicaCote d'IvoireCroatiaCubaCyprusCzech RepublicDenmarkDominicaDominican RepublicEarly-demographic dividendEast Asia & PacificEast Asia & Pacific (excluding high income)East Asia & Pacific (IDA & IBRD countries)EcuadorEgypt, Arab Rep.El SalvadorEquatorial GuineaEritreaEstoniaEuro areaEurope & Central AsiaEurope & Central Asia (excluding high income)Europe & Central Asia (IDA & IBRD countries)European UnionFaroe IslandsFijiFinlandFragile and conflict affected situationsFranceGabonGambia, TheGeorgiaGermanyGhanaGreeceGrenadaGuatemalaGuineaGuinea-BissauGuyanaHaitiHeavily indebted poor countries (HIPC)High incomeHondurasHong Kong SAR, ChinaHungaryIBRD onlyIcelandIDA & IBRD totalIDA blendIDA onlyIDA totalIndiaIndonesiaIran, Islamic Rep.IraqIrelandIsraelItalyJamaicaJapanJordanKazakhstanKenyaKiribatiKorea, Rep.KosovoKuwaitKyrgyz RepublicLao PDRLate-demographic dividendLatin America & Caribbean Latin America & Caribbean (excluding high income)Latin America & the Caribbean (IDA & IBRD countries)LatviaLeast developed countries: UN classificationLebanonLiberiaLibyaLithuaniaLow & middle incomeLow incomeLower middle incomeLuxembourgMacao SAR, ChinaMacedonia, FYRMadagascarMalawiMalaysiaMaldivesMaliMaltaMauritaniaMauritiusMexicoMiddle East & North AfricaMiddle East & North Africa (excluding high income)Middle East & North Africa (IDA & IBRD countries)Middle incomeMoldovaMongoliaMontenegroMoroccoMozambiqueMyanmarNamibiaNepalNetherlandsNew ZealandNicaraguaNigerNigeriaNorth AmericaNorwayOECD membersOmanOther small statesPacific island small statesPakistanPalauPanamaParaguayPeruPhilippinesPolandPortugalPost-demographic dividendPre-demographic dividendPuerto RicoQatarRomaniaRussian FederationRwandaSamoaSaudi ArabiaSenegalSerbiaSeychellesSierra LeoneSingaporeSlovak RepublicSloveniaSmall statesSolomon IslandsSouth AfricaSouth AsiaSouth Asia (IDA & IBRD)South SudanSpainSri LankaSt. Kitts and NevisSt. LuciaSt. Vincent and the GrenadinesSub-Saharan Africa Sub-Saharan Africa (excluding high income)Sub-Saharan Africa (IDA & IBRD countries)SudanSurinameSwazilandSwedenSwitzerlandTajikistanTanzaniaThailandTimor-LesteTogoTongaTrinidad and TobagoTunisiaTurkeyTurkmenistanUgandaUkraineUnited Arab EmiratesUnited KingdomUnited StatesUpper middle incomeUruguayUzbekistanVanuatuVenezuela, RBVietnamWest Bank and GazaWorldYemen, Rep.ZambiaZimbabwe Timeline:
This timeline shows a graph from 1971 to 2014 of Cuba. No data until 1970. Number of actual observations by date: 44.
Source name:
World Development Indicators
Source organization:
World Bank national accounts data, and OECD National Accounts data files.
Categories, topics:
Economy & Growth, Trade
Last updated:
apr 23, 2017
Indicators value changes by year
Minimum:
3.236 bln
jan 1, 1994
Maximum:
11.806 bln
jan 1, 2014
At the date of observation
Value
Absolute change
Change from previous value
jan 1, 1971
4.515 bln
+4.515 bln
0.0%
jan 1, 1972
4.904 bln
+388.164 mln
8.6%
jan 1, 1973
5.14 bln
+236.443 mln
4.82%
jan 1, 1974
5.315 bln
+174.959 mln
3.4%
jan 1, 1975
5.365 bln
+49.868 mln
0.94%
jan 1, 1976
5.882 bln
+516.702 mln
9.63%
jan 1, 1977
6.201 bln
+319.027 mln
5.42%
jan 1, 1978
6.735 bln
+534.283 mln
8.62%
jan 1, 1979
7.168 bln
+433.13 mln
6.43%
jan 1, 1980
7.237 bln
+68.822 mln
0.96%
jan 1, 1981
6.96 bln
-276.588 mln
-3.82%
jan 1, 1982
8.27 bln
+1.31 bln
18.82%
jan 1, 1983
8.963 bln
+693.007 mln
8.38%
jan 1, 1984
9.401 bln
+437.574 mln
4.88%
jan 1, 1985
10.148 bln
+746.939 mln
7.95%
jan 1, 1986
11.048 bln
+900.1 mln
8.87%
jan 1, 1987
10.043 bln
-1.005 bln
-9.1%
jan 1, 1988
9.87 bln
-173.146 mln
-1.72%
jan 1, 1989
10.18 bln
+310.206 mln
3.14%
jan 1, 1990
10.524 bln
+343.863 mln
3.38%
jan 1, 1991
9.944 bln
-579.641 mln
-5.51%
jan 1, 1992
6.252 bln
-3.692 bln
-37.13%
jan 1, 1993
3.422 bln
-2.83 bln
-45.27%
jan 1, 1994
3.236 bln
-185.638 mln
-5.43%
jan 1, 1995
3.856 bln
+620.238 mln
19.17%
jan 1, 1996
4.3 bln
+443.795 mln
11.51%
jan 1, 1997
5.344 bln
+1.044 bln
24.28%
jan 1, 1998
5.245 bln
-99.375 mln
-1.86%
jan 1, 1999
5.317 bln
+72.009 mln
1.37%
jan 1, 2000
5.446 bln
+129.292 mln
2.43%
jan 1, 2001
5.434 bln
-12.06 mln
-0.22%
jan 1, 2002
5.23 bln
-203.968 mln
-3.75%
jan 1, 2003
4.848 bln
-381.846 mln
-7.3%
jan 1, 2004
5.436 bln
+587.902 mln
12.13%
jan 1, 2005
6.142 bln
+705.598 mln
12.98%
jan 1, 2006
7.724 bln
+1.583 bln
25.77%
jan 1, 2007
9.303 bln
+1.578 bln
20.43%
jan 1, 2008
9.2 bln
-102.506 mln
-1.1%
jan 1, 2009
9.878 bln
+678.348 mln
7.37%
jan 1, 2010
8.403 bln
-1.476 bln
-14.94%
jan 1, 2011
11.401 bln
+2.998 bln
35.68%
jan 1, 2012
11.18 bln
-220.376 mln
-1.93%
jan 1, 2013
10.901 bln
-279.654 mln
-2.5%
jan 1, 2014
11.806 bln
+905.331 mln
8.31%
Ranking of countries by current statistics by years


Comments: