29
/
en
AIzaSyAYiBZKx7MnpbEhh9jyipgxe19OcubqV5w
April 1, 2024
163877
Japan
JPN
true
2
1
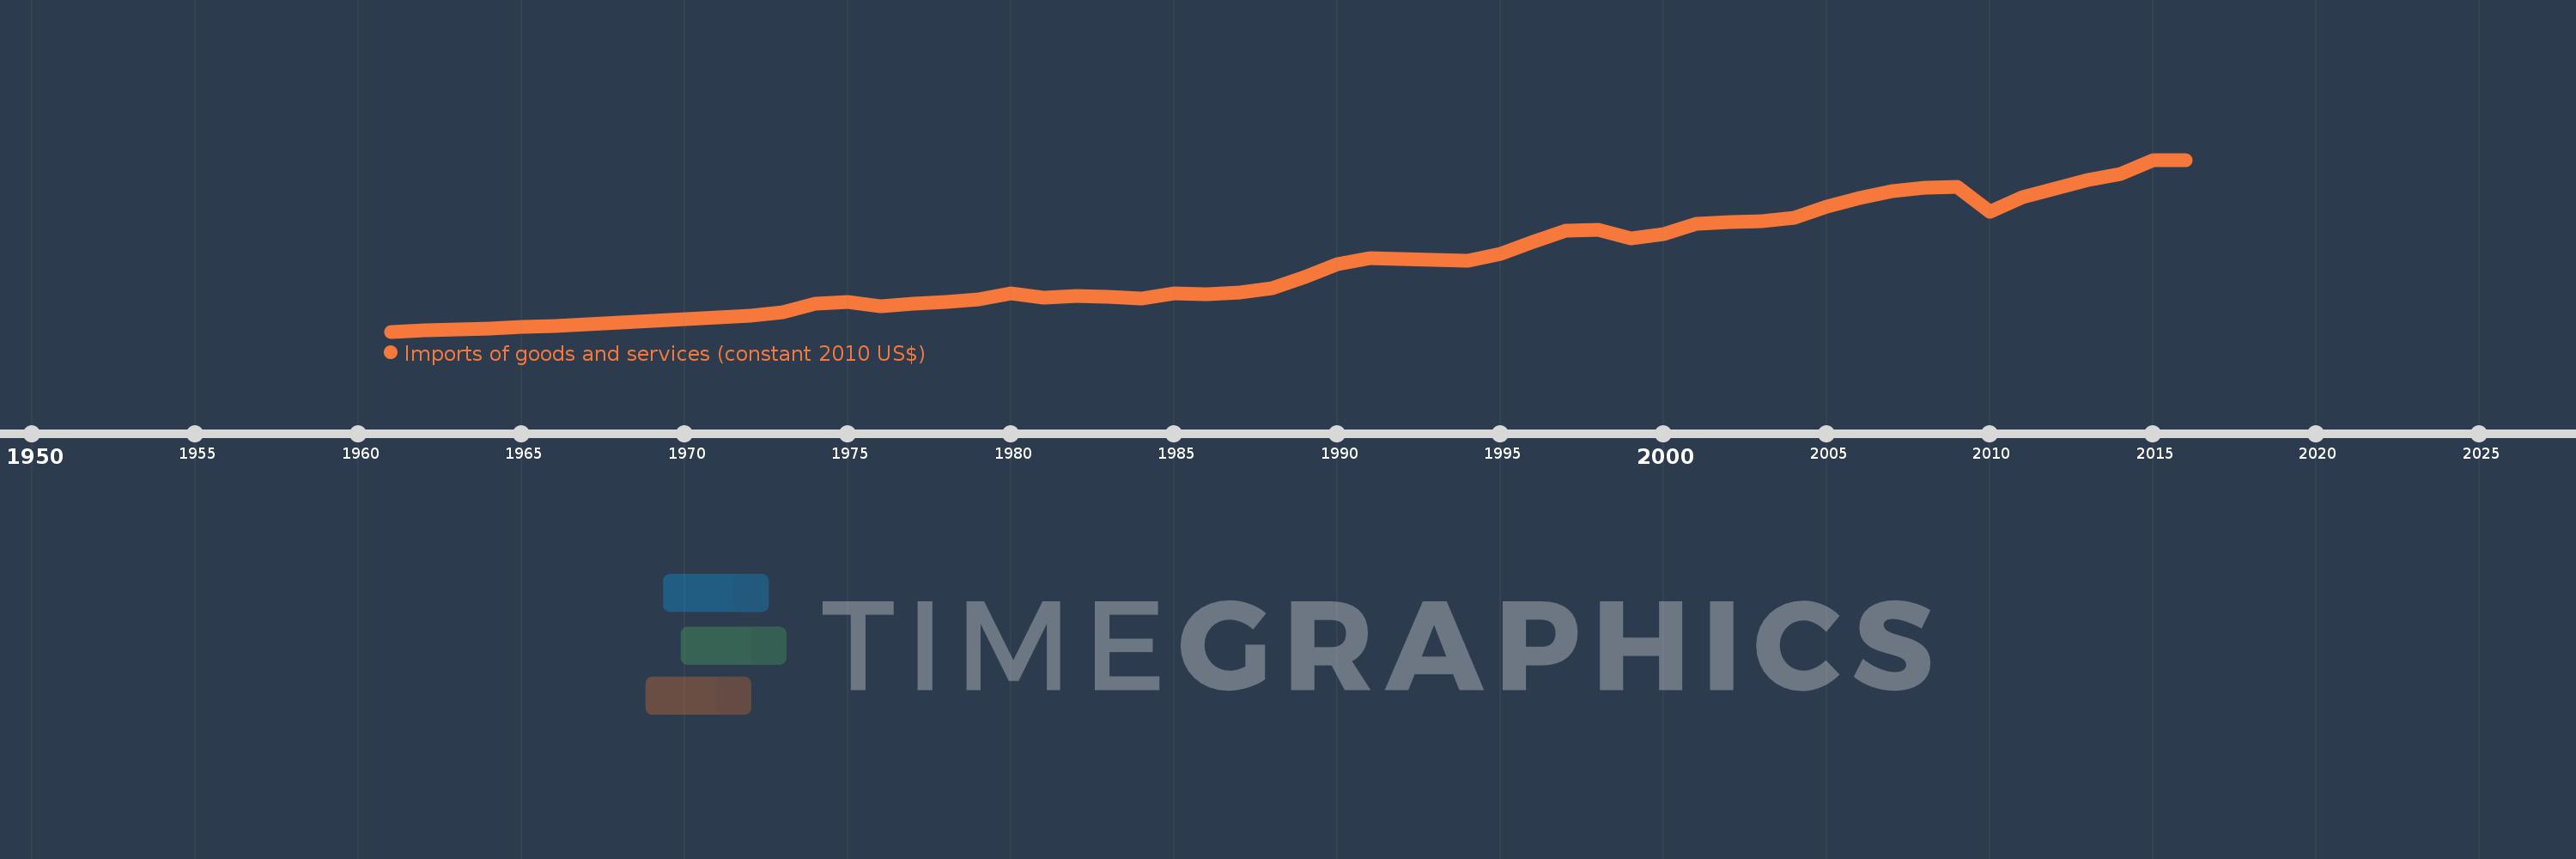
Imports of goods and services (constant 2010 US$)
2016,2015,2014,2013,2012,2011,2010,2009,2008,2007,2006,2005,2004,2003,2002,2001,2000,1999,1998,1997,1996,1995,1994,1993,1992,1991,1990,1989,1988,1987,1986,1985,1984,1983,1982,1981,1980,1979,1978,1977,1976,1975,1974,1973,1972,1971,1970,1969,1968,1967,1966,1965,1964,1963,1962,1961
This statistics in other country:
AfghanistanAlbaniaAlgeriaAngolaAntigua and BarbudaArab WorldArgentinaArmeniaArubaAustraliaAustriaAzerbaijanBahamas, TheBahrainBangladeshBarbadosBelarusBelgiumBelizeBeninBermudaBhutanBoliviaBosnia and HerzegovinaBotswanaBrazilBrunei DarussalamBulgariaBurkina FasoBurundiCabo VerdeCambodiaCameroonCanadaCaribbean small statesCentral African RepublicCentral Europe and the BalticsChadChileChinaColombiaComorosCongo, Dem. Rep.Congo, Rep.Costa RicaCote d'IvoireCroatiaCubaCyprusCzech RepublicDenmarkDominicaDominican RepublicEarly-demographic dividendEast Asia & PacificEast Asia & Pacific (excluding high income)East Asia & Pacific (IDA & IBRD countries)EcuadorEgypt, Arab Rep.El SalvadorEquatorial GuineaEritreaEstoniaEuro areaEurope & Central AsiaEurope & Central Asia (excluding high income)Europe & Central Asia (IDA & IBRD countries)European UnionFaroe IslandsFijiFinlandFragile and conflict affected situationsFranceGabonGambia, TheGeorgiaGermanyGhanaGreeceGrenadaGuatemalaGuineaGuinea-BissauGuyanaHaitiHeavily indebted poor countries (HIPC)High incomeHondurasHong Kong SAR, ChinaHungaryIBRD onlyIcelandIDA & IBRD totalIDA blendIDA onlyIDA totalIndiaIndonesiaIran, Islamic Rep.IraqIrelandIsraelItalyJamaicaJapanJordanKazakhstanKenyaKiribatiKorea, Rep.KosovoKuwaitKyrgyz RepublicLao PDRLate-demographic dividendLatin America & Caribbean Latin America & Caribbean (excluding high income)Latin America & the Caribbean (IDA & IBRD countries)LatviaLeast developed countries: UN classificationLebanonLiberiaLibyaLithuaniaLow & middle incomeLow incomeLower middle incomeLuxembourgMacao SAR, ChinaMacedonia, FYRMadagascarMalawiMalaysiaMaldivesMaliMaltaMauritaniaMauritiusMexicoMiddle East & North AfricaMiddle East & North Africa (excluding high income)Middle East & North Africa (IDA & IBRD countries)Middle incomeMoldovaMongoliaMontenegroMoroccoMozambiqueMyanmarNamibiaNepalNetherlandsNew ZealandNicaraguaNigerNigeriaNorth AmericaNorwayOECD membersOmanOther small statesPacific island small statesPakistanPalauPanamaParaguayPeruPhilippinesPolandPortugalPost-demographic dividendPre-demographic dividendPuerto RicoQatarRomaniaRussian FederationRwandaSamoaSaudi ArabiaSenegalSerbiaSeychellesSierra LeoneSingaporeSlovak RepublicSloveniaSmall statesSolomon IslandsSouth AfricaSouth AsiaSouth Asia (IDA & IBRD)South SudanSpainSri LankaSt. Kitts and NevisSt. LuciaSt. Vincent and the GrenadinesSub-Saharan Africa Sub-Saharan Africa (excluding high income)Sub-Saharan Africa (IDA & IBRD countries)SudanSurinameSwazilandSwedenSwitzerlandTajikistanTanzaniaThailandTimor-LesteTogoTongaTrinidad and TobagoTunisiaTurkeyTurkmenistanUgandaUkraineUnited Arab EmiratesUnited KingdomUnited StatesUpper middle incomeUruguayUzbekistanVanuatuVenezuela, RBVietnamWest Bank and GazaWorldYemen, Rep.ZambiaZimbabwe Timeline:
This timeline shows a graph from 1961 to 2016 of Japan. No data until 1960. Number of actual observations by date: 56.
Source name:
World Development Indicators
Source organization:
World Bank national accounts data, and OECD National Accounts data files.
Categories, topics:
Economy & Growth, Trade
Last updated:
apr 23, 2017
Indicators value changes by year
Minimum:
75.517 bln
jan 1, 1961
Maximum:
966.243 bln
jan 1, 2016
At the date of observation
Value
Absolute change
Change from previous value
jan 1, 1961
75.517 bln
+75.517 bln
0.0%
jan 1, 1962
80.838 bln
+5.32 bln
7.05%
jan 1, 1963
86.533 bln
+5.695 bln
7.05%
jan 1, 1964
92.629 bln
+6.096 bln
7.05%
jan 1, 1965
99.155 bln
+6.526 bln
7.05%
jan 1, 1966
106.141 bln
+6.986 bln
7.05%
jan 1, 1967
113.619 bln
+7.478 bln
7.05%
jan 1, 1968
121.624 bln
+8.005 bln
7.05%
jan 1, 1969
130.192 bln
+8.569 bln
7.05%
jan 1, 1970
139.365 bln
+9.172 bln
7.05%
jan 1, 1971
149.183 bln
+9.819 bln
7.05%
jan 1, 1972
159.694 bln
+10.51 bln
7.05%
jan 1, 1973
176.463 bln
+16.77 bln
10.5%
jan 1, 1974
219.402 bln
+42.938 bln
24.33%
jan 1, 1975
228.575 bln
+9.173 bln
4.18%
jan 1, 1976
205.054 bln
-23.521 bln
-10.29%
jan 1, 1977
218.742 bln
+13.688 bln
6.68%
jan 1, 1978
227.688 bln
+8.946 bln
4.09%
jan 1, 1979
243.424 bln
+15.736 bln
6.91%
jan 1, 1980
274.856 bln
+31.432 bln
12.91%
jan 1, 1981
253.524 bln
-21.332 bln
-7.76%
jan 1, 1982
258.94 bln
+5.416 bln
2.14%
jan 1, 1983
257.196 bln
-1.744 bln
-0.67%
jan 1, 1984
248.339 bln
-8.856 bln
-3.44%
jan 1, 1985
274.507 bln
+26.168 bln
10.54%
jan 1, 1986
267.121 bln
-7.386 bln
-2.69%
jan 1, 1987
277.155 bln
+10.033 bln
3.76%
jan 1, 1988
302.148 bln
+24.993 bln
9.02%
jan 1, 1989
358.533 bln
+56.385 bln
18.66%
jan 1, 1990
423.048 bln
+64.515 bln
17.99%
jan 1, 1991
457.339 bln
+34.291 bln
8.11%
jan 1, 1992
452.252 bln
-5.088 bln
-1.11%
jan 1, 1993
447.335 bln
-4.917 bln
-1.09%
jan 1, 1994
441.588 bln
-5.747 bln
-1.28%
jan 1, 1995
477.774 bln
+36.186 bln
8.19%
jan 1, 1996
539.507 bln
+61.733 bln
12.92%
jan 1, 1997
599.007 bln
+59.5 bln
11.03%
jan 1, 1998
601.091 bln
+2.084 bln
0.35%
jan 1, 1999
560.767 bln
-40.324 bln
-6.71%
jan 1, 2000
580.986 bln
+20.219 bln
3.61%
jan 1, 2001
634.824 bln
+53.838 bln
9.27%
jan 1, 2002
641.357 bln
+6.533 bln
1.03%
jan 1, 2003
645.764 bln
+4.407 bln
0.69%
jan 1, 2004
667.697 bln
+21.933 bln
3.4%
jan 1, 2005
721.918 bln
+54.221 bln
8.12%
jan 1, 2006
765.955 bln
+44.037 bln
6.1%
jan 1, 2007
802.009 bln
+36.054 bln
4.71%
jan 1, 2008
819.529 bln
+17.52 bln
2.18%
jan 1, 2009
825.24 bln
+5.71 bln
0.7%
jan 1, 2010
696.086 bln
-129.153 bln
-15.65%
jan 1, 2011
773.859 bln
+77.773 bln
11.17%
jan 1, 2012
818.773 bln
+44.914 bln
5.8%
jan 1, 2013
863.066 bln
+44.292 bln
5.41%
jan 1, 2014
891.319 bln
+28.253 bln
3.27%
jan 1, 2015
965.013 bln
+73.694 bln
8.27%
jan 1, 2016
966.243 bln
+1.23 bln
0.13%
Ranking of countries by current statistics by years


Comments: